

Adaptation to human populations is revealed by within-host polymorphisms in HIV-1 and hepatitis C virus
- PMID: 17397261
- PMCID: PMC1839164
- DOI: 10.1371/journal.ppat.0030045
Adaptation to human populations is revealed by within-host polymorphisms in HIV-1 and hepatitis C virus
Abstract
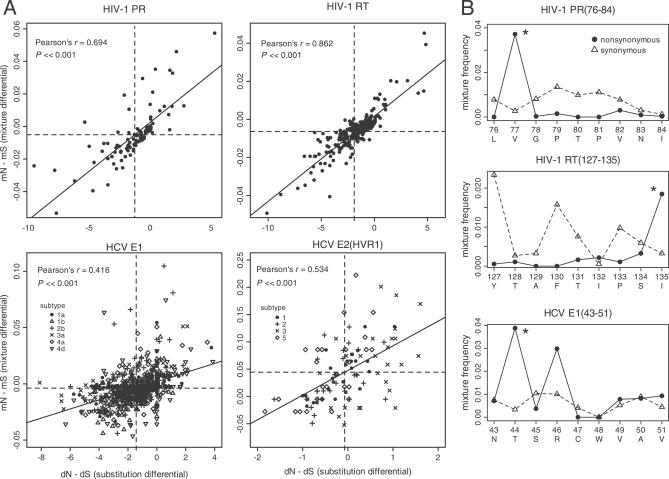
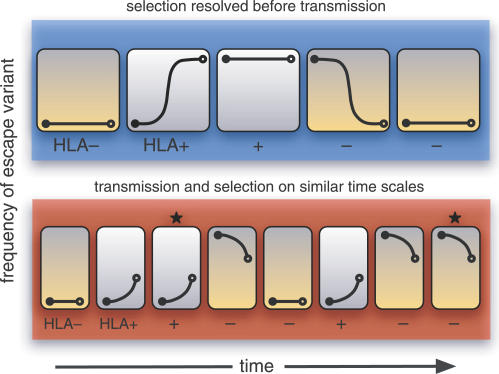
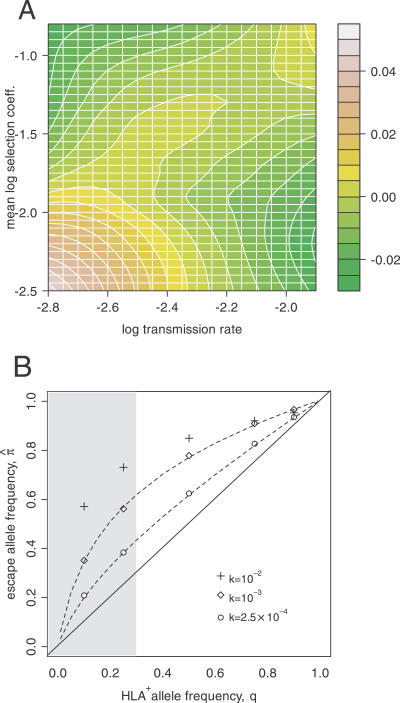
CD8(+) cytotoxic T-lymphocytes (CTLs) perform a critical role in the immune control of viral infections, including those caused by human immunodeficiency virus type 1 (HIV-1) and hepatitis C virus (HCV). As a result, genetic variation at CTL epitopes is strongly influenced by host-specific selection for either escape from the immune response, or reversion due to the replicative costs of escape mutations in the absence of CTL recognition. Under strong CTL-mediated selection, codon positions within epitopes may immediately "toggle" in response to each host, such that genetic variation in the circulating virus population is shaped by rapid adaptation to immune variation in the host population. However, this hypothesis neglects the substantial genetic variation that accumulates in virus populations within hosts. Here, we evaluate this quantity for a large number of HIV-1- (n > or = 3,000) and HCV-infected patients (n > or = 2,600) by screening bulk RT-PCR sequences for sequencing "mixtures" (i.e., ambiguous nucleotides), which act as site-specific markers of genetic variation within each host. We find that nonsynonymous mixtures are abundant and significantly associated with codon positions under host-specific CTL selection, which should deplete within-host variation by driving the fixation of the favored variant. Using a simple model, we demonstrate that this apparently contradictory outcome can be explained by the transmission of unfavorable variants to new hosts before they are removed by selection, which occurs more frequently when selection and transmission occur on similar time scales. Consequently, the circulating virus population is shaped by the transmission rate and the disparity in selection intensities for escape or reversion as much as it is shaped by the immune diversity of the host population, with potentially serious implications for vaccine design.
Conflict of interest statement
Figures
References
-
- Bowen DG, Walker CM. Adaptive immune responses in acute and chronic hepatitis C virus infection. Nature. 2005;436:946–952. - PubMed
-
- Klein J. Natural history of the major histocompatibility complex. New York: Wiley; 1986. 775
-
- Pircher H, Moskkophidis D, Rohrer U, Bürki K, Hengartner H, et al. Viral escape by selection of cytotoxic T cell-resistant virus variants in vivo. Nature. 1990;346:629–633. - PubMed
Publication types
MeSH terms
Substances
Associated data
- Actions
- Actions
- Actions
- Actions
- Actions
- Actions
- Actions
- Actions
- Actions
- Actions
- Actions
- Actions
- Actions
- Actions
- Actions
- Actions
- Actions
- Actions
- Actions
- Actions
- Actions
- Actions
- Actions
- Actions
- Actions
- Actions
- Actions
- Actions
- Actions
- Actions
- Actions
- Actions
- Actions
- Actions
- Actions
- Actions
- Actions
- Actions
- Actions
- Actions
- Actions
- Actions
- Actions
- Actions
- Actions
- Actions
- Actions
- Actions
- Actions
- Actions
- Actions
- Actions
- Actions
- Actions
- Actions
- Actions
- Actions
- Actions
- Actions
- Actions
- Actions
- Actions
- Actions
- Actions
- Actions
- Actions
- Actions
- Actions
- Actions
- Actions
- Actions
- Actions
- Actions
- Actions
- Actions
- Actions
- Actions
- Actions
- Actions
- Actions
- Actions
- Actions
- Actions
- Actions
- Actions
- Actions
- Actions
- Actions
- Actions
- Actions
- Actions
- Actions
- Actions
- Actions
- Actions
- Actions
- Actions
- Actions
- Actions
- Actions
- Actions
- Actions
- Actions
- Actions
- Actions
- Actions
- Actions
- Actions
- Actions
- Actions
- Actions
- Actions
- Actions
- Actions
- Actions
- Actions
- Actions
- Actions
- Actions
- Actions
- Actions
- Actions
- Actions
- Actions
- Actions
- Actions
- Actions
- Actions
- Actions
- Actions
- Actions
- Actions
- Actions
- Actions
- Actions
- Actions
- Actions
- Actions
- Actions
- Actions
- Actions
- Actions
- Actions
- Actions
- Actions
- Actions
- Actions
- Actions
- Actions
- Actions
- Actions
- Actions
- Actions
- Actions
- Actions
- Actions
- Actions
- Actions
- Actions
- Actions
- Actions
- Actions
- Actions
- Actions
- Actions
- Actions
- Actions
- Actions
- Actions
- Actions
- Actions
- Actions
- Actions
- Actions
- Actions
- Actions
- Actions
- Actions
- Actions
- Actions
- Actions
- Actions
- Actions
- Actions
- Actions
- Actions
- Actions
- Actions
- Actions
- Actions
- Actions
- Actions
- Actions
- Actions
- Actions
- Actions
- Actions
- Actions
- Actions
- Actions
- Actions
- Actions
- Actions
- Actions
- Actions
- Actions
- Actions
- Actions
- Actions
- Actions
- Actions
- Actions
- Actions
- Actions
- Actions
- Actions
- Actions
- Actions
- Actions
- Actions
- Actions
- Actions
- Actions
- Actions
- Actions
- Actions
- Actions
- Actions
- Actions
- Actions
- Actions
- Actions
- Actions
- Actions
- Actions
- Actions
- Actions
- Actions
- Actions
- Actions
- Actions
- Actions
- Actions
- Actions
- Actions
- Actions
- Actions
- Actions
- Actions
- Actions
- Actions
- Actions
- Actions
- Actions
- Actions
- Actions
- Actions
- Actions
- Actions
- Actions
- Actions
- Actions
- Actions
- Actions
- Actions
- Actions
- Actions
- Actions
- Actions
- Actions
- Actions
- Actions
- Actions
- Actions
- Actions
- Actions
- Actions
- Actions
- Actions
- Actions
- Actions
- Actions
- Actions
- Actions
- Actions
- Actions
- Actions
- Actions
- Actions
- Actions
- Actions
- Actions
- Actions
- Actions
- Actions
- Actions
- Actions
- Actions
- Actions
- Actions
- Actions
- Actions
- Actions
- Actions
- Actions
- Actions
- Actions
- Actions
- Actions
- Actions
- Actions
- Actions
- Actions
- Actions
- Actions
- Actions
- Actions
- Actions
- Actions
- Actions
- Actions
- Actions
- Actions
- Actions
- Actions
- Actions
- Actions
- Actions
- Actions
- Actions
- Actions
- Actions
- Actions
- Actions
- Actions
- Actions
- Actions
- Actions
- Actions
- Actions
- Actions
- Actions
- Actions
- Actions
- Actions
- Actions
- Actions
Grants and funding
LinkOut - more resources
Full Text Sources
Research Materials
