. 2007 Apr 2:8:14.
doi: 10.1186/1471-2350-8-14.

Analysis of meiotic recombination in 22q11.2, a region that frequently undergoes deletions and duplications

Affiliations

Analysis of meiotic recombination in 22q11.2, a region that frequently undergoes deletions and duplications

Laura Torres-Juan et al. BMC Med Genet. .

Abstract

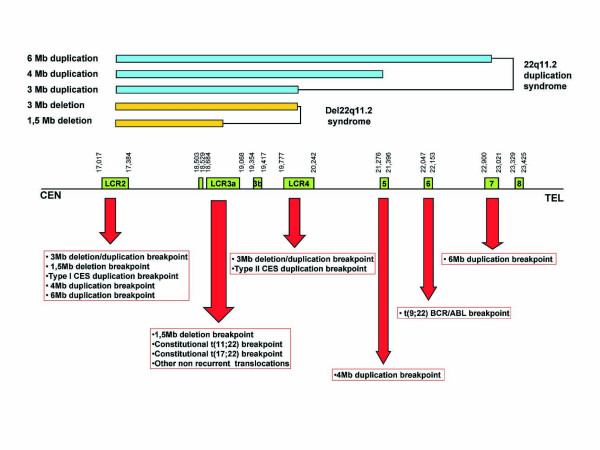
Background: The 22q11.2 deletion syndrome is the most frequent genomic disorder with an estimated frequency of 1/4000 live births. The majority of patients (90%) have the same deletion of 3 Mb (Typically Deleted Region, TDR) that results from aberrant recombination at meiosis between region specific low-copy repeats (LCRs).

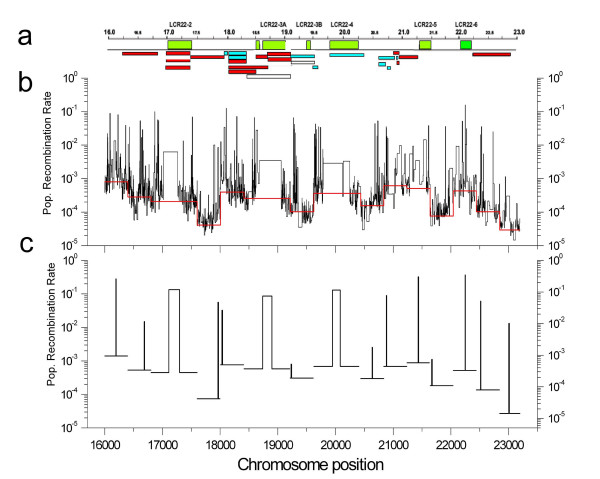
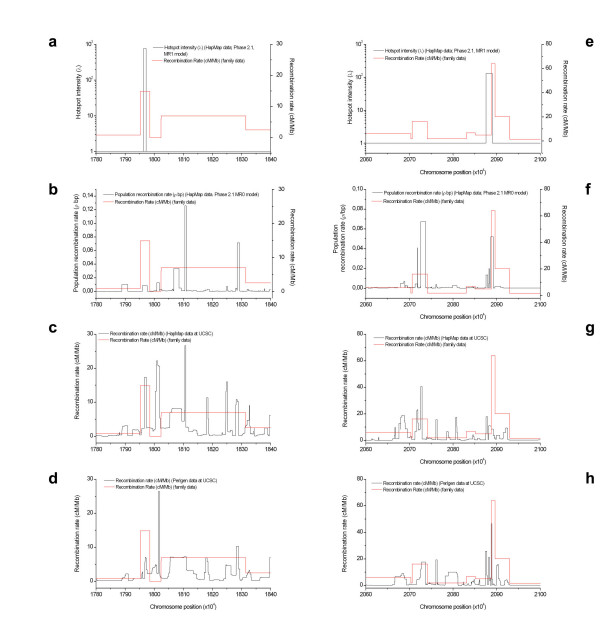
Methods: As a first step towards the characterization of recombination rates and breakpoints within the 22q11.2 region we have constructed a high resolution recombination breakpoint map based on pedigree analysis and a population-based historical recombination map based on LD analysis.

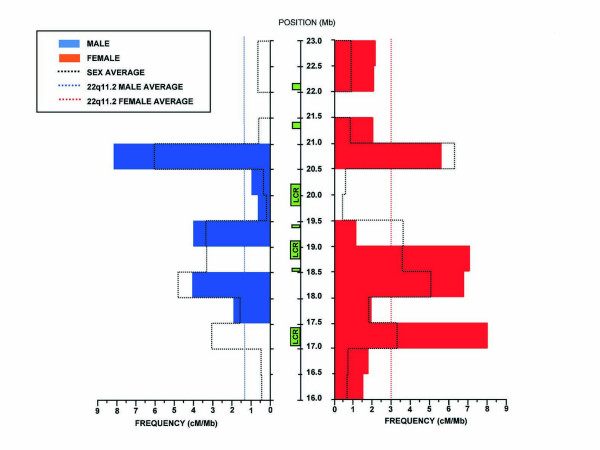
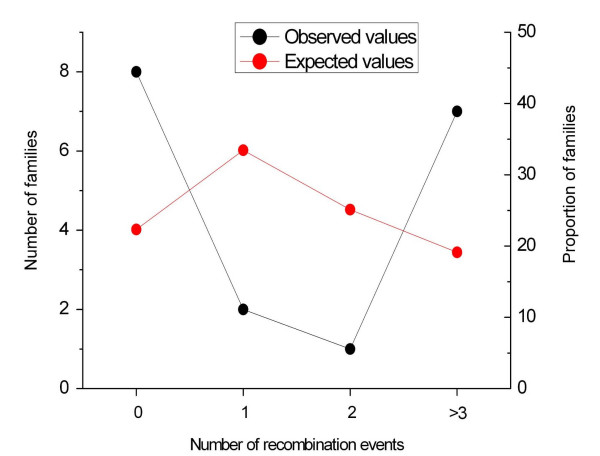
Results: Our pedigree map allows the location of recombination breakpoints with a high resolution (potential recombination hotspots), and this approach has led to the identification of 5 breakpoint segments of 50 kb or less (8.6 kb the smallest), that coincide with historical hotspots. It has been suggested that aberrant recombination leading to deletion (and duplication) is caused by low rates of Allelic Homologous Recombination (AHR) within the affected region. However, recombination rate estimates for 22q11.2 region show that neither average recombination rates in the 22q11.2 region or within LCR22-2 (the LCR implicated in most deletions and duplications), are significantly below chromosome 22 averages. Furthermore, LCR22-2, the repeat most frequently implicated in rearrangements, is also the LCR22 with the highest levels of AHR. In addition, we find recombination events in the 22q11.2 region to cluster within families. Within this context, the same chromosome recombines twice in one family; first by AHR and in the next generation by NAHR resulting in an individual affected with the del22q11.2 syndrome.

Conclusion: We show in the context of a first high resolution pedigree map of the 22q11.2 region that NAHR within LCR22 leading to duplications and deletions cannot be explained exclusively under a hypothesis of low AHR rates. In addition, we find that AHR recombination events cluster within families. If normal and aberrant recombination are mechanistically related, the fact that LCR22s undergo frequent AHR and that we find familial differences in recombination rates within the 22q11.2 region would have obvious health-related implications.


Figures

Figure 1
Figure 1
Map showing recurrent breakpoints of germline and somatic deletions, duplications and translocations that have been described within the 22q11.2 region. Yellow lines indicate the length of deletions and blue lines the length of duplications (CES: Cat eye syndrome).
Figure 2
Figure 2
Pedigree-based recombination breakpoint map based on the typing of 62 polymorphic markers (38 designed for this study; CATCH markers) in 14 extensive families totaling 204 meiosis. We localized a total of 27 single recombination events. The 22q11.2 region is drawn to scale including the locations of the LCR22s (green boxes) and the position of the polymorphic markers used. Blue, red and white lines represent regions to where male (blue), female (red) and unknown sex (white) recombination breakpoints have been narrowed down. Genes TBX1 and CRKL that are implicated in the clinical manifestations of the del22q11.2 syndrome are shown, as is the IGL locus also mentioned in the text.
Figure 3
Figure 3
Variation of recombination rates along the 22q11.2 region. We show 14 intervals of 500 kb and calculated the frequency of recombination (cM/Mb) for each. On the left, in blue we show male recombination rates and on the right, in red, female recombination rates. Dotted lines show sex-averaged recombination, while dotted red and blue lines show the female and male recombination averages for the entire 22q11.2 region.
Figure 4
Figure 4
Comparison between the population-based linkage-disequilibrium map and the pedigree-based linkage map. A, An outline of the pedigree-based linkage map according to Figure 1. B, Population based linkage-disequilibrium SNP map. The map was constructed using genotype information publicly available from the HapMap project site , for a total of 2074 SNPs of 60 unrelated individuals corresponding to parents of the CEPH dataset (Utah residents with ancestry from northern and western Europe; CEU). Background population recombination rate (ρ) per base pair and the factor by which the recombination rate between two adjacent SNPs exceeds the background rate (λ) were estimated for each window by the PHASE v2.1.1 software using the general model for recombination rate variation (-MR0 option). We plotted the ρ value for each window (red line) and the λρ value for each SNP interval (black line). C, The presence of a recombination hotspot was estimated for each window using the simple hotspot model for recombination (-MR1 option). We estimated ρ and λ inside the hot spot region and the hot spot boundaries defined by their left and right ends and plotted the λρ value across each window (black lines).
Figure 5
Figure 5
Hotspot prediction and comparison between historical and contemporary recombination rates in two regions of high marker density in the pedigree-based map. Charts a-d are for the region between positions 17,80 and 18,40 Mb and e-h for the region between positions 20,60 and 21,00 Mb. In all charts recombination rates based on family data are shown in red. Charts a and e shows the prediction of hotspot intensity and location (PHASE 2.1.1 software, -MR1 option) in the region. Charts b and f show population recombination rate profile (PHASE 2.1.1 software, -MR0 option) based on our analysis. Charts c and g show population recombination rate profiles as shown in the UCSC genome web tracks based on Hapmap data. Charts d and h show population recombination rate profiles as shown in the UCSC genome web tracks based on Perlegen data.
Figure 6
Figure 6
Pedigree and haplotype data of a family with a member affected with the del22q11.2 syndrome and carrying the 3 Mb deletion caused by an interchromosomal NAHR event. The NAHR event was of maternal origin and in the previous generation there is a female AHR event within LCR22-2 that did not cause a deletion. The AHR event has been arbitrarily assigned to the mother of the deleted child.
Figure 7
Figure 7
Recombination events per family within the Typically Deleted Region (TDR) in a sample of 18 large families with 10 or more meiosis analyzed. Observed values are statistically different from those expected under a Poisson distribution (χ2 = 13.06, 2 df; P = 0.0016 and Mean distance test of Poissonity, P = 0.0033). We take this to indicate that some families have a higher tendency to recombine within the TDR region than others.

References

    1. Stankiewicz P, Lupski JR. Genome architecture, rearrangements and genomic disorders. Trends Genet. 2002;18:74–82. doi: 10.1016/S0168-9525(02)02592-1. - DOI - PubMed
    1. Dunham I, Shimizu N, Roe BA, Chissoe S, Hunt AR, Collins JE, Bruskiewich R, Beare DM, Clamp M, Smink LJ, Ainscough R, Almeida JP, Babbage A, Bagguley C, Bailey J, Barlow K, Bates KN, Beasley O, Bird CP, Blakey S, Bridgeman AM, Buck D, Burgess J, Burrill WD, O'Brien KP, . The DNA sequence of human chromosome 22. Nature. 1999;402:489–495. doi: 10.1038/990031. - DOI - PubMed
    1. Edelmann L, Pandita RK, Spiteri E, Funke B, Goldberg R, Palanisamy N, Chaganti RS, Magenis E, Shprintzen RJ, Morrow BE. A common molecular basis for rearrangement disorders on chromosome 22q11. Hum Mol Genet. 1999;8:1157–1167. doi: 10.1093/hmg/8.7.1157. - DOI - PubMed
    1. Shaikh TH, Kurahashi H, Emanuel BS. Evolutionarily conserved low copy repeats (LCRs) in 22q11 mediate deletions, duplications, translocations, and genomic instability: an update and literature review. Genet Med. 2001;3:6–13. - PubMed
    1. McDermid HE, Morrow BE. Genomic disorders on 22q11. Am J Hum Genet. 2002;70:1077–1088. doi: 10.1086/340363. - DOI - PMC - PubMed

Publication types

Substances