. 2007 Jun;118(6):1360-8.
doi: 10.1016/j.clinph.2007.02.021. Epub 2007 Mar 29.

Effect of sleep on interictal spikes and distribution of sleep spindles on electrocorticography in children with focal epilepsy

Affiliations

Effect of sleep on interictal spikes and distribution of sleep spindles on electrocorticography in children with focal epilepsy

Eishi Asano et al. Clin Neurophysiol. 2007 Jun.

Abstract

Objective: To determine how sleep with central spindles alters the spatial distribution of interictal spike frequency in children with intractable focal seizures, and whether such children have spindles arising from the medial temporal region in addition to the frontal-central region.

Methods: Seventeen children (age: 7 months-17 years) were studied using extraoperative electrocorticography (ECoG).

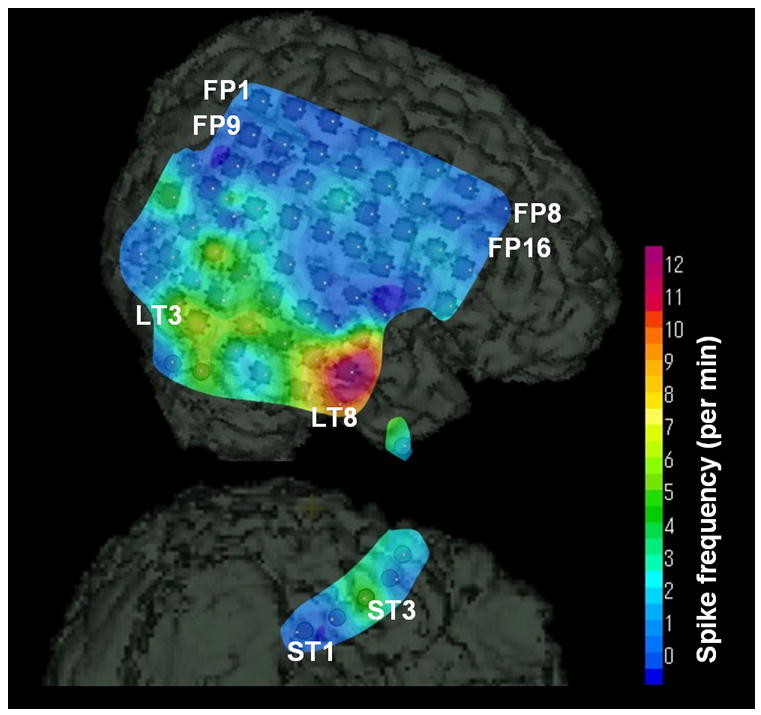
Results: Overall spike frequency across the subdural electrodes was greater during sleep with central spindles compared to wakefulness. In 13 children showing at least 1 spike/min in an electrode, the spatial distribution of spike frequency was similar during wakefulness and sleep; in addition, the spike frequency was greater in the seizure onset zones compared to the non-onset areas, regardless of wakefulness or sleep. Spindles were identified in the medial temporal region during sleep with central spindles in all 17 children.

Conclusion: Overall spike frequency may be increased by sleep with spindles, but the spatial distribution of spike frequency appears similar during wakefulness and sleep in children with intractable focal seizures.

Significance: Both awake and sleep ECoG may be useful to predict seizure onset zones in children with intractable focal epilepsy. Medial temporal spindles are present in some children with focal epilepsy.


Figures

Figure 1
Figure 1. A 15-year-old boy with uncontrolled focal seizures associated with a tumor in the left superior temporal gyrus
(A) On interictal ECoG recording, sleep spindles were independently or simultaneously noted in the left frontal-central region (arrowheads) and the left medial temporal region (arrows). Visual assessment revealed that the amplitude of spindles in the medial temporal region was about twice as high as those in the frontal-central region. A low frequency filter of 1.0 Hz and a high frequency filter of 70Hz were applied. (B and C) A typical ictal ECoG trace is shown. A low frequency filter of 1.0 Hz and a high frequency filter of 70Hz were applied. The seizure onset zone was localized to the left superior temporal gyrus surrounding the tumor. Ictal ECoG discharges consisted of low-amplitude fast wave bursts at electrode D3. The ictal discharges gradually evolved into irregular rhythmic polyspike-and-wave bursts, and involved the adjacent temporal neocortices including electrodes C2, C3, C4, D2, D4 and B4. This ictal ECoG finding was consistent with his seizure semiology, which was characterized by auditory aura followed by altered consciousness, right-sided facial twitching and occasional secondary generalized tonic clonic convulsion. Medial temporal spindles were intermittently noted during the seizure (arrows), but did not participate in the ictal discharges. (D) The topography of central spindles was delineated on his own three-dimensional reconstructed surface MR image, using a method similar to that previously described (Asano et al, 2004b). To obtain reference-free topographic maps of spectral measures, all signals were re-montaged to an average reference (Hart et al, 1998; Asano et al, 2005). A total of 40 1.28-second epochs of interest were placed on sleep ECoG segments exactly showing central spindles, and an averaged amplitude spectral curve was created for each epoch. Then, a spindle magnitude (defined as the area under the averaged spectral curve within a 12–16Hz band) was determined for each electrode. Increased spindle magnitude was noted mainly in the left premotor region. Increased spindle magnitude in the medial temporal region here may be associated with the observation that some central spindles were noted simultaneously to those in the medial temporal region. (E) The topography of spindles in the medial temporal region was similarly delineated; using spindle magnitudes derived from a total of 40 1.28-second epochs of interest placed on sleep ECoG segments exactly showing spindles in the medial temporal region. (F) Fluid-attenuated inversion recovery (FLAIR) MRI images showed a well-defined hyperintense lesion in the left superior temporal gyrus but no evidence of abnormality in the left hippocampus. Lesionectomy plus additional cortical resection involving the left superior temporal gyrus, preserving the left hippocampus, resulted in seizure-free outcome (follow-up period: 27 months).
Figure 2
Figure 2. A 7-month-old girl with uncontrolled tonic seizures associated with cortical dysplasia involving the right temporal neocortex
(A) Scalp EEG recording showed central spindles (arrowheads) bilaterally with their fields minimally involving the temporal regions. Frequent interictal spike activity was noted in the right temporal-parietal region. (B) On interictal ECoG recording, sleep spindles were noted in the left frontal-central region (arrowhead) and the left medial temporal region (arrow). The amplitude of spindles in the medial temporal region was about equal to that in the frontal-central region on ECoG recording. Medial temporal spindles appeared independent of interictal spikes arising from the temporal neocortex (see electrodes LT3 - LT8). A low frequency filter of 1.0 Hz and a high frequency filter of 70Hz were applied. (C) A surface topography of interictal spike frequency during wakefulness is delineated on her own three-dimensional reconstructed surface MR image. (D) Interictal spike frequency during sleep with spindles is similarly delineated. The spatial distribution of spike frequency was similar between during wakefulness and sleep with spindles (rho=0.88; p<0.0001; Spearman’s rank correlation). (E) Seizure onset zones are shown as red electrodes. Cortical resection involving the left temporal-parietal-occipital region resulted in seizure-free outcome (follow-up period: 29 months).

References

    1. Asano E, Muzik O, Shah A, Juhász C, Chugani DC, Sood S, Janisse J, Ergun EL, Ahn-Ewing J, Shen C, Gotman J, Chugani HT. Quantitative interictal subdural EEG analyses in children with neocortical epilepsy. Epilepsia. 2003;44:425–434. - PubMed
    1. Asano E, Benedek K, Shah A, Juhasz C, Shah J, Chugani DC, Muzik O, Sood S, Chugani HT. Is intraoperative electrocorticography reliable in children with intractable neocortical epilepsy? Epilepsia. 2004a;45:1091–1099. - PMC - PubMed
    1. Asano E, Muzik O, Shah A, Juhasz C, Chugani DC, Kagawa K, Benedek K, Sood S, Gotman J, Chugani HT. Quantitative visualization of ictal subdural EEG changes in children with neocortical focal seizures. Clin Neurophysiol. 2004b;115:2718–2727. - PMC - PubMed
    1. Asano E, Juhasz C, Shah A, Muzik O, Chugani DC, Shah J, Sood S, Chugani HT. Origin and propagation of epileptic spasms delineated on electrocorticography. Epilepsia. 2005;46:1086–1097. - PMC - PubMed
    1. Brazier MA. Studies of the EEG activity of limbic structures in man. Electroencephalogr Clin Neurophysiol. 1968;25:309–318. - PubMed

Publication types