. 2007 Apr;4(4):499-507.
doi: 10.1016/j.hrthm.2006.12.032. Epub 2006 Dec 28.

Ionic mechanisms underlying region-specific remodeling of rabbit atrial action potentials caused by intermittent burst stimulation

Affiliations

Ionic mechanisms underlying region-specific remodeling of rabbit atrial action potentials caused by intermittent burst stimulation

Wen Dun et al. Heart Rhythm. 2007 Apr.

Abstract

Background: Pulmonary veins (PVs) and the coronary sinus (CS) play pivotal roles in triggering some episodes of atrial fibrillation. In isolated rabbit right or left atrial preparations, a 3-hour intermittent burst pacing protocol shortens action potential duration (APD) in CS and PV, but not in sinus node (SN) and left Bachmann bundle (BB) regions.

Objective: The purpose of this study was to use patch clamp techniques to study the rapidly inactivating (I(to)) and sustained (I(sus)) K(+) currents as well as Ca(2+) currents (I(Ca)) in cells dispersed from intermittent burst pacing and sham PV, BB, CS, and SN regions to determine whether changes in these currents contributed to APD shortening.

Methods: Real-time polymerase chain reaction was performed for transient outward K(+) and Ca(2+) channel subunit mRNAs to determine if intermittent burst pacing affected expression levels.

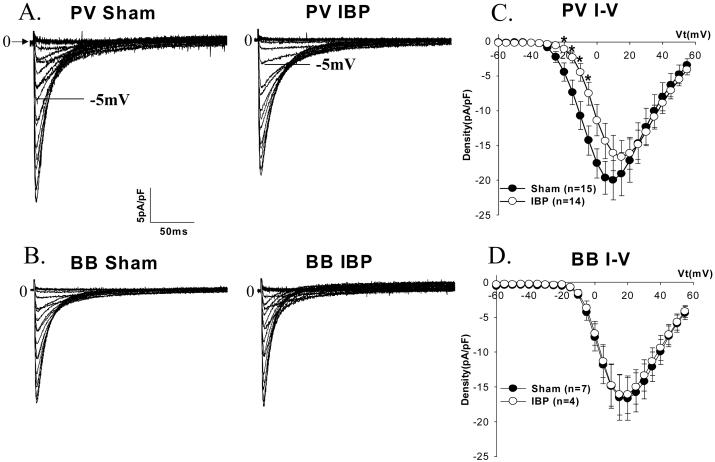
Results: I(to) densities were unaffected by intermittent burst pacing in PV and Bachmann bundle cells. mRNA levels of K(V)4.3, K(V)4.2, K(V)1.4, and KChIP2 subunits of I(to) in both regions were stable. In CS cells, I(to) densities in intermittent burst pacing were greater than in sham (P <.05), but there were no parallel mRNA changes. I(Ca) density of PV cells was reduced from 14.27 +/- 2.08 pA/pF (at -5 mV) in sham to 7.52 +/- 1.65 pA/pF in intermittent burst pacing PV cells (P <.05) due to a significant shift in voltage dependence of activation. These results were seen in the absence of mRNA changes in alpha(1C) and alpha(1D) Ca(2+) channel subunits. In contrast, intermittent burst pacing had no effect on Ca(2+) current densities and kinetics of CS cells, but decreased alpha(1)C and alpha(1)D mRNA levels.

Conclusion: There is region-specific remodeling of I(to) and I(Ca) by intermittent burst pacing protocols in rabbit atrium. Increased I(to) in CS cells could account for the APD shortening observed with intermittent burst pacing, whereas an intermittent burst pacing-induced shift in voltage dependence of activation may contribute to APD shortening in PV cells.


Figures

Figure 1
Figure 1
I-V relation curves of Ito and Isus in PV and BB cells. A and B, Representative current recordings in cells isolated from PV (A) and BB (B) regions. The data were obtained with a prepulse potential of -90 mV from a holding potential of -60 mV with 10-mV depolarizing steps to voltages from -50 mV to +60 mV. C and D, I-V relation for Ito(C) and Isus(D) as a function of test potential, respectively. Data are mean±SEM (PV Sham, n=13; PV IBP, n=14; BB Sham, n=9; BB IBP, n=7).
Figure 2
Figure 2
I-V relation curves of Ito and Isus in CS and SN cells. A and B, Representative current recordings in cells isolated from CS (A) and SN (B) regions. The data were obtained with a prepulse potential of -90 mV from a holding potential of -60 mV with 10-mV depolarizing steps to voltages from -50 mV to +60 mV. C and D, I-V relation for Ito(C) and Isus(D) as a function of test potential, respectively. Data are mean±SEM (PV Sham, n=13; PV IBP, n=14; BB Sham, n=9; BB IBP, n=7).
Figure 3
Figure 3
Top. A and B, Representative recordings at Vt +40mV from Vh -60 mV showing the effect of C9356 on Ito and Isus in cells isolated from PV (A) and BB (B) regions. C and D, I-V relations of C9356-insensitive (C) and C9356-sensitive (D) currents. Data are mean±SEM (PV Sham, n=12; PV IBP, n=8; BB Sham, n=6; BB IBP, n=6).Figure 3 Bottom. A and B, Representative recordings at Vt +40mV from Vh -60 mV showing the effect of C9356 on Ito and Isus in cells isolated from CS (A) and SN (B) regions. C and D, I-V relations of C9356-insensitive (C) and C9356-sensitive (D) currents. Data are mean±SEM (CS Sham, n=5; CS IBP, n=6; SN Sham, n=6; SN IBP, n=6).
Figure 3
Figure 3
Top. A and B, Representative recordings at Vt +40mV from Vh -60 mV showing the effect of C9356 on Ito and Isus in cells isolated from PV (A) and BB (B) regions. C and D, I-V relations of C9356-insensitive (C) and C9356-sensitive (D) currents. Data are mean±SEM (PV Sham, n=12; PV IBP, n=8; BB Sham, n=6; BB IBP, n=6).Figure 3 Bottom. A and B, Representative recordings at Vt +40mV from Vh -60 mV showing the effect of C9356 on Ito and Isus in cells isolated from CS (A) and SN (B) regions. C and D, I-V relations of C9356-insensitive (C) and C9356-sensitive (D) currents. Data are mean±SEM (CS Sham, n=5; CS IBP, n=6; SN Sham, n=6; SN IBP, n=6).
Figure 4
Figure 4
Effects of IBP on mRNA levels of Kv4.3, Kv1.4, Kv1.5 in CS, SN, PV and BB. A.U. is a relative arbitrary unit. Presented are means±SE (n=7 rabbits per group). BB: left Bachmann’s bundle. PV: pulmonary veins. SN: sinus node. CS: coronary sinus.
Figure 5
Figure 5
Top. A and B, Original tracings of ICa in Sham and IBP cells from PV (A) and BB (B) regions under conditions of these experiments: Ca2+ 3mM; BAPTA 10mM; holding voltage, -70 mV to various test voltages from -60 mV to +55 mV. Arrows indicate 0 current. C and D, Average peak ICa density-voltage relations in PV and BB. Data were collected at similar times (10 min) after whole-cell membrane rupture. Data were mean±SE. Figure 5 Bottom. E and F, Activation curves in PV and BB cells. V0.5 and slope factor k were calculated from current-voltage protocol and ERev and are shown in Table S6. IBP PV cells showed significant positive shifts of activation curves vs Sham PV cells. All data were collected same time (10 min) after whole cell rupture.
Figure 5
Figure 5
Top. A and B, Original tracings of ICa in Sham and IBP cells from PV (A) and BB (B) regions under conditions of these experiments: Ca2+ 3mM; BAPTA 10mM; holding voltage, -70 mV to various test voltages from -60 mV to +55 mV. Arrows indicate 0 current. C and D, Average peak ICa density-voltage relations in PV and BB. Data were collected at similar times (10 min) after whole-cell membrane rupture. Data were mean±SE. Figure 5 Bottom. E and F, Activation curves in PV and BB cells. V0.5 and slope factor k were calculated from current-voltage protocol and ERev and are shown in Table S6. IBP PV cells showed significant positive shifts of activation curves vs Sham PV cells. All data were collected same time (10 min) after whole cell rupture.
Figure 6
Figure 6
Top. A and B, Original tracings of ICa in Sham and IBP cells from CS (A) and SN (B) regions under conditions of these experiments: Ca2+ 3mM; BAPTA 10mM; holding voltage, -70 mV to various test voltages from -60 mV to +55 mV. Arrows indicate 0 current. C and D, Average peak ICa density-voltage relations in CS and SN. Data were collected at similar times (10 min) after whole-cell membrane rupture. Data were mean±SE. Figure 6 Bottom. E and F, Activation curves CS and SN cells. V0.5 and slope factor k were calculated from current-voltage protocol and ERev, and mean values are shown in Table S7. There are no significant shifts of activation curves between Sham and IBP in CS and SN cells. All data were collected same time (10 min) after whole cell rupture.
Figure 6
Figure 6
Top. A and B, Original tracings of ICa in Sham and IBP cells from CS (A) and SN (B) regions under conditions of these experiments: Ca2+ 3mM; BAPTA 10mM; holding voltage, -70 mV to various test voltages from -60 mV to +55 mV. Arrows indicate 0 current. C and D, Average peak ICa density-voltage relations in CS and SN. Data were collected at similar times (10 min) after whole-cell membrane rupture. Data were mean±SE. Figure 6 Bottom. E and F, Activation curves CS and SN cells. V0.5 and slope factor k were calculated from current-voltage protocol and ERev, and mean values are shown in Table S7. There are no significant shifts of activation curves between Sham and IBP in CS and SN cells. All data were collected same time (10 min) after whole cell rupture.
Figure 7
Figure 7
Effects of IBP on mRNA levels of Cav1.2 and α-2/δ subunits in CS and SN. A.U. is a relative arbitrary unit. Presented are means±SE (N=7 rabbits per group). SN: sinus node. CS: coronary sinus.

Similar articles

Cited by

References

    1. Sosunov EA, Anyukhovsky EP, Hefer D, Rosen TS, Danilo J, Janse MJ, Rosen MR. Region-specific, pacing-induced changes in repolarization in rabbit atrium: An example of sensitivity to the rare. Cardiovasc Res. 2005;67:274–282. - PubMed
    1. Haissaguerre M, Jais P, Shah DC, Takahashi A, Hocini M, Quiniou G, Garrigue S, Le Mouroux A, Le Metayer P, Clementy J. Spontaneous Initiation of Atrial Fibrillation by Ectopic Beats Originating in the Pulmonary Veins. N Engl J Med. 1998;339:659–666. - PubMed
    1. Oral H, Knight BP, Ozaydin M, Chugh A, Lai SWK, Scharf C, Hassan S, Greenstein R, Han JD, Pelosi F, Jr., Strickberger SA, Morady F. Segmental Ostial Ablation to Isolate the Pulmonary Veins During Atrial Fibrillation: Feasibility and Mechanistic Insights. Circulation. 2002;106:1256–1262. - PubMed
    1. Oral H, Ozaydin M, Chugh A, Scharf C, Tada H, Hall B, Cheung P, Pelosi F, Knight BP, Morady F. Role of coronary sinus in maintenance of atrial fibrillation. J Cardiovasc Electr. 2003;14:1329–1336. - PubMed
    1. Volkmer M, Antz M, Hebe J, Kuck KH. Focal atrial tachycardia originating from the musculature of the coronary sinus. J Cardiovasc Electr. 2002;13:68–71. - PubMed

Publication types

MeSH terms