. 2007 Jun;143(6):1013-23.
doi: 10.1016/j.ajo.2007.02.022. Epub 2007 Apr 2.

Severity of visual field loss and health-related quality of life

Affiliations

Severity of visual field loss and health-related quality of life

Roberta McKean-Cowdin et al. Am J Ophthalmol. 2007 Jun.

Abstract

Purpose: To examine the association between severity of visual field loss (VFL) and self-reported health-related quality of life (HRQOL) in a population-based sample.

Design: Population-based cross-sectional study.

Methods: Participants in the Los Angeles Latino Eye Study (LALES) underwent a comprehensive ophthalmic examination including visual field testing by the Humphrey Automated Field Analyzer II (Swedish Interactive Thresholding Algorithm [SITA] Standard 24-2) [Carl Zeiss Meditec, Dublin, California, USA]. Mean deviation (MD) scores were used to determine severity of VFL both as a continuous variable and stratified by severity: no VFL (MD >or= -2 decibels [dB]), mild VFL (-6 dB < MD < -2 dB), and moderate to severe VFL (MD < -6 dB). HRQOL was assessed by the Medical Outcomes Study 12-item Short-Form Health Survey (SF-12) and the National Eye Institute Visual Function Questionnaire (NEI-VFQ-25). Linear regression analyses and analysis of covariance were used to assess the relationship between HRQOL scores and VFL.

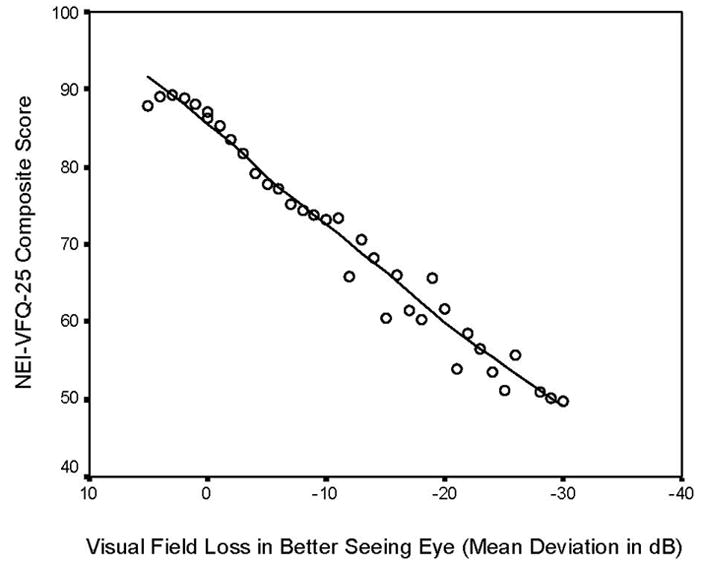
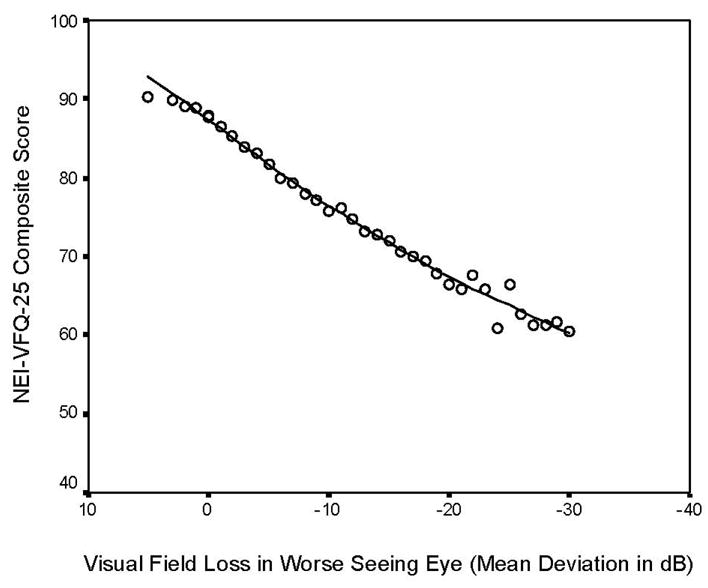
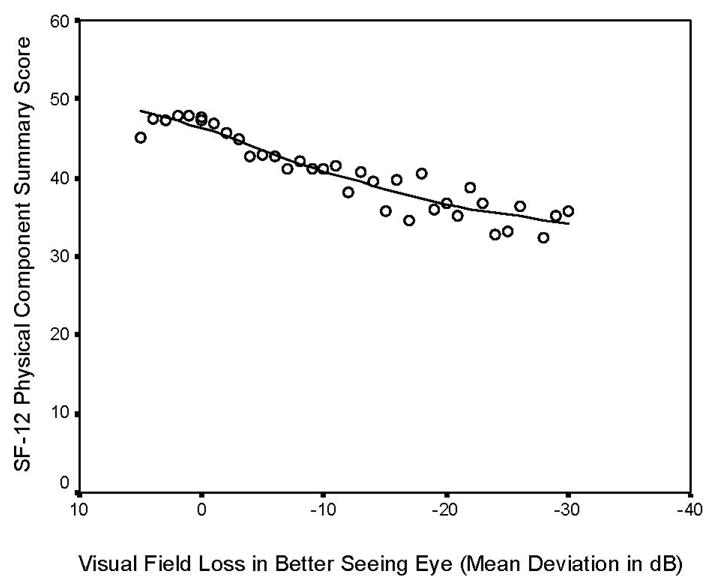
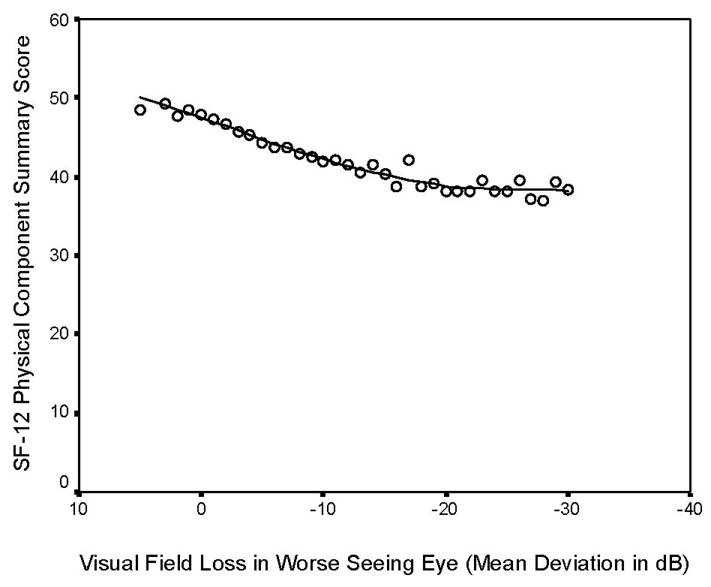
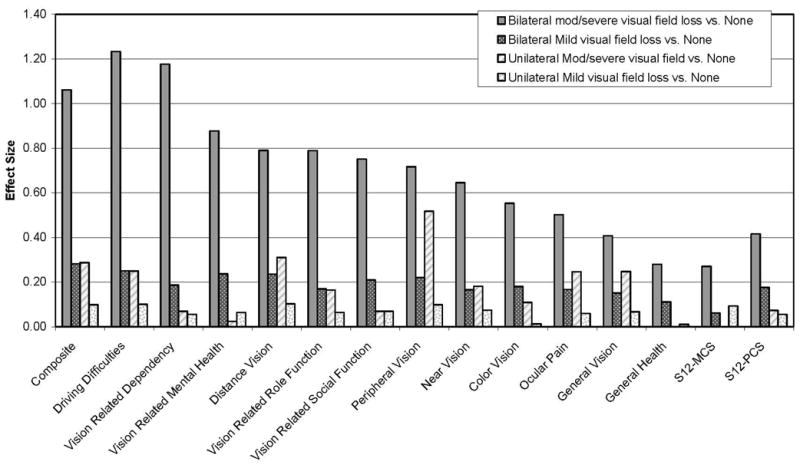
Results: Of the 5,213 participants included in this study, 18% had unilateral mild, 1.5% unilateral moderate to severe, 19% bilateral mild, and 6.5% bilateral moderate to severe VFL. Worse NEI-VFQ-25 and SF-12 HRQOL scores were associated with VFL in a linear manner. Four- to 5-dB differences in VFL were associated with a five-point difference in the NEI-VFQ-25 composite and most subscale scores. Persons with VFL had the greatest difficulty with driving activities, dependency, mental health, distance vision, and peripheral vision.

Conclusions: HRQOL is diminished even in persons with relatively mild VFL on the basis of MD scores. Prevention and management of persons with VFL may be important in preventing or reducing poor HRQOL related to difficulties in driving, distance and peripheral vision activities, and a sense of dependency.


Figures

Figure 1
Figure 1
Linear regression plot of NEI-VFQ-25 composite scores and visual field loss (Mean Deviation scores in decibels) in better seeing eye. The NEI- VFQ-25 composite scores are adjusted for co-variates including age, gender, education, employment status, income, acculturation, co-morbidities, health insurance, vision insurance, and visual acuity impairment. The mean deviation-specific data of all persons by each unit of mean deviation of visual field loss were plotted to show the independent relationship of visual field loss with vision-specific quality of life.
Figure 2
Figure 2
Linear regression plot of NEI-VFQ-25 composite scores and visual field loss (Mean Deviation scores in decibels) in worse seeing eye. The NEI- VFQ-25 composite scores are adjusted for co-variates including age, gender, education, employment status, income, acculturation, co-morbidities, health insurance, vision insurance, and visual acuity impairment. The mean deviation-specific data of all persons by each unit of mean deviation of visual field loss were plotted to show the independent relationship of visual field loss with vision-specific quality of life.
Figure 3
Figure 3
Linear regression plot of SF-12 Physical Composite Scores and visual field loss (Mean Deviation scores in decibels) in better seeing eye. The SF-12 Physical Composite scores are adjusted for co-variates including age, gender, education, employment status, income, acculturation, comorbidities, health insurance, vision insurance, and visual acuity impairment. The mean deviation-specific data of all persons by each unit of mean deviation of visual field loss were plotted to show the independent relationship of visual field loss with generic health-related quality of life.
Figure 4
Figure 4
Linear regression plot of SF-12 Physical Composite scores and visual field loss (Mean Deviation scores in decibels) in worse seeing eye. The SF-12 Physical Composite scores are adjusted for co-variates including age, gender, education, employment status, income, acculturation, comorbidities, health insurance, vision insurance, and visual acuity impairment. The mean deviation-specific data of all persons by each unit of mean deviation of visual field loss were plotted to show the independent relationship of visual field loss with generic health-related quality of life.
Figure 5
Figure 5
Comparison of Effect Sizes between the No Visual Field Loss Subgroup with Subgroups with Different Severity Levels of Visual Field Loss. The level of visual field loss was stratified into five categories: no VFL (MD>−2 dB in both eyes), unilateral mild VFL(−6 dB≤MD≤ −2 dB in the worse eye), unilateral moderate/severe VFL(MD<−6 dB in one eye, MD>−2 dB in the other eye), bilateral mild VFL(−6 dB≤MD≤ −2 dB in both eyes; or −6 dB ≤MD≤ −2 dB in one eye, MD<−6 dB in the other eye), and bilateral moderate/severe VFL(MD<−6 dB in the both eyes). The effect size was calculated as the difference in the adjusted mean scores (between each of the severity level of visual field loss and no visual field loss) divided by the standard deviation for the no visual field loss group. Subscales are clustered in decreasing order of effect sizes for the bilateral moderate/severe visual field loss vs. none groups, for the National Eye Institute Visual Function Questionnaire (NEI-VFQ-25) vision-related subscales, and the Medical Outcomes Study 12-ltem Short-Form Health Survey (SF-12) general health subscale scores. Effect sizes below 0.20 represent “no significant effect”. An effect size of 0.20~0.49 is considered small effect, 0.50~0.79 as medium effect, and 0.80+ as a large effect.

References

    1. Friedman DS, Congdon N, Kempen J, Tielsch JM. Vision Problems in the U.S., Prevalence of Adult Vision Impairment and Age-Related Eye Disease in America. Bethesda, MD: National Eye Institute; 2002. p. 1.
    1. Nelson P, Aspinall P, O’Brien C. Patients’ perception of visual impairment in glaucoma: a pilot study. Br J Ophthalmol. 1999;83:546–52. - PMC - PubMed
    1. Sherwood MB, Garcia-Siekavizza A, Meltzer MI, Hebert A, Burns AF, McGorray S. Glaucoma’s impact on quality of life and its relation to clinical indicators. A pilot study Ophthalmology. 1998;105:561–6. - PubMed
    1. Klein BE, Klein R, Lee KE, Cruickshanks KJ. Performance-based and self-assessed measures of visual function as related to history of falls, hip fractures, and measured gait time. The Beaver Dam Eye Study. Ophthalmology. 1998;105:160–4. - PubMed
    1. McCarty CA, Nanjan MB, Taylor HR. Vision impairment predicts 5 year mortality. Br J Ophthalmol. 2001;85:322–6. - PMC - PubMed

Publication types