. 2007 May;9(3):277-92.
doi: 10.1016/j.ymben.2007.01.003. Epub 2007 Feb 23.

Metabolic flux analysis in a nonstationary system: fed-batch fermentation of a high yielding strain of E. coli producing 1,3-propanediol

Affiliations

Metabolic flux analysis in a nonstationary system: fed-batch fermentation of a high yielding strain of E. coli producing 1,3-propanediol

Maciek R Antoniewicz et al. Metab Eng. 2007 May.

Abstract

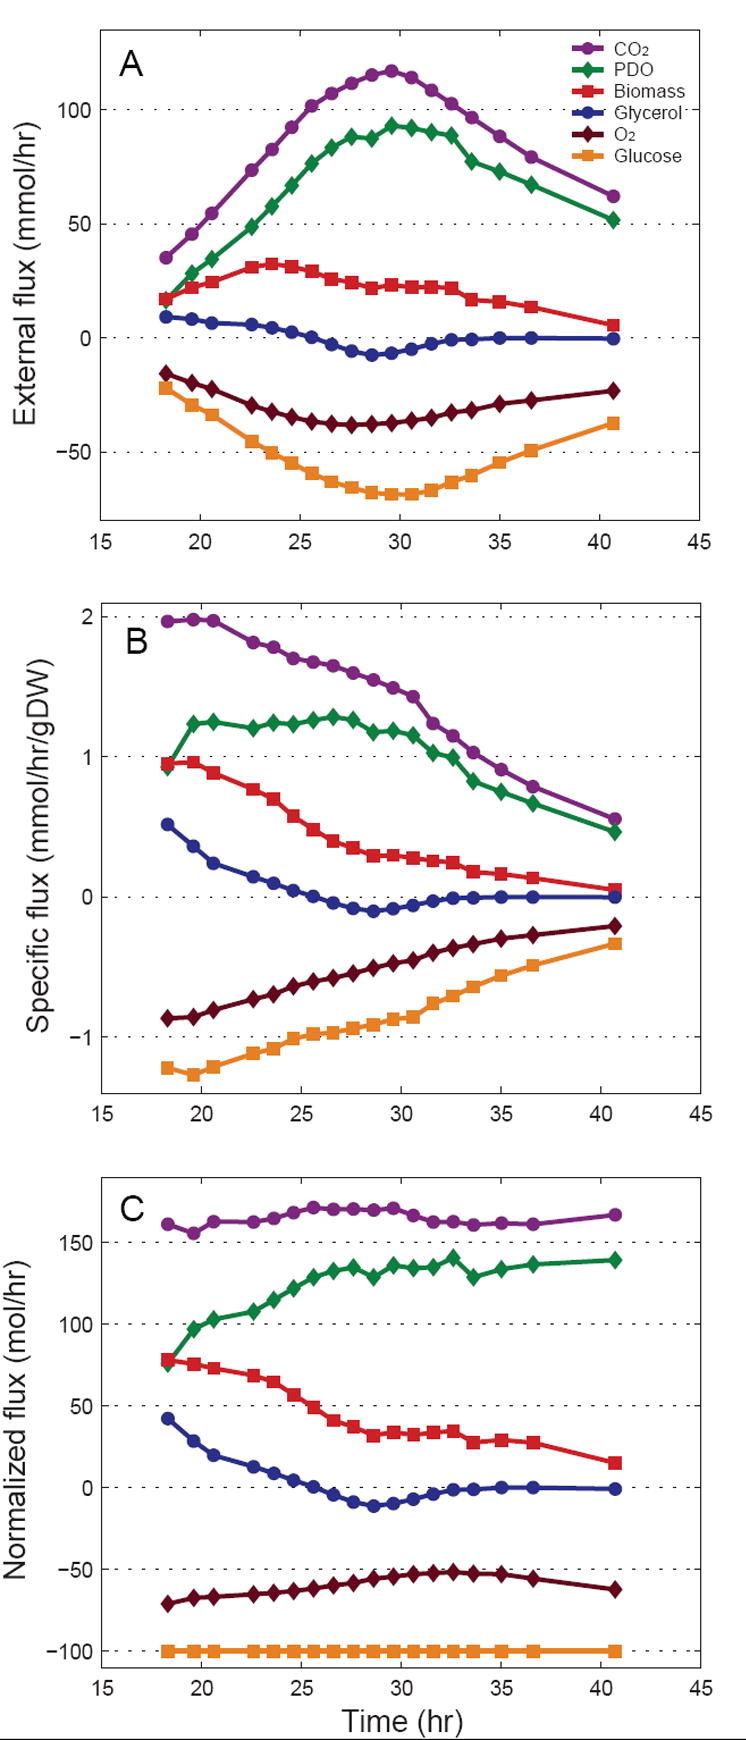
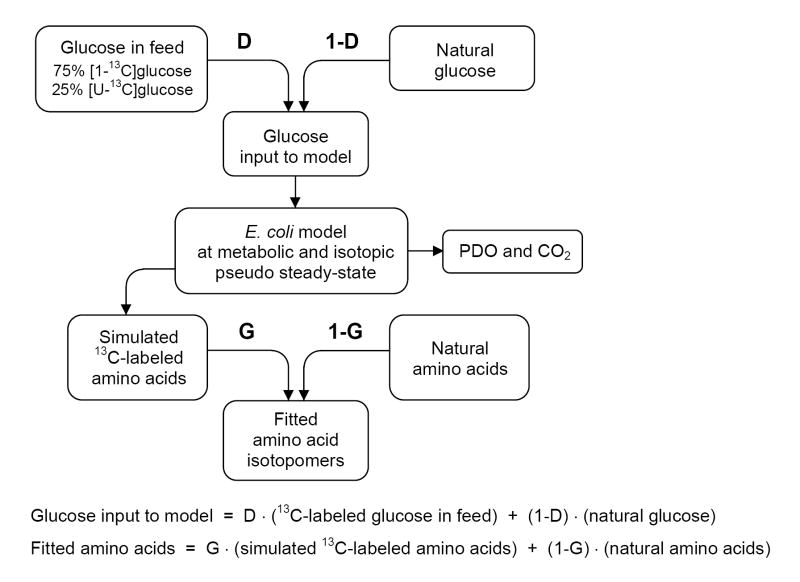
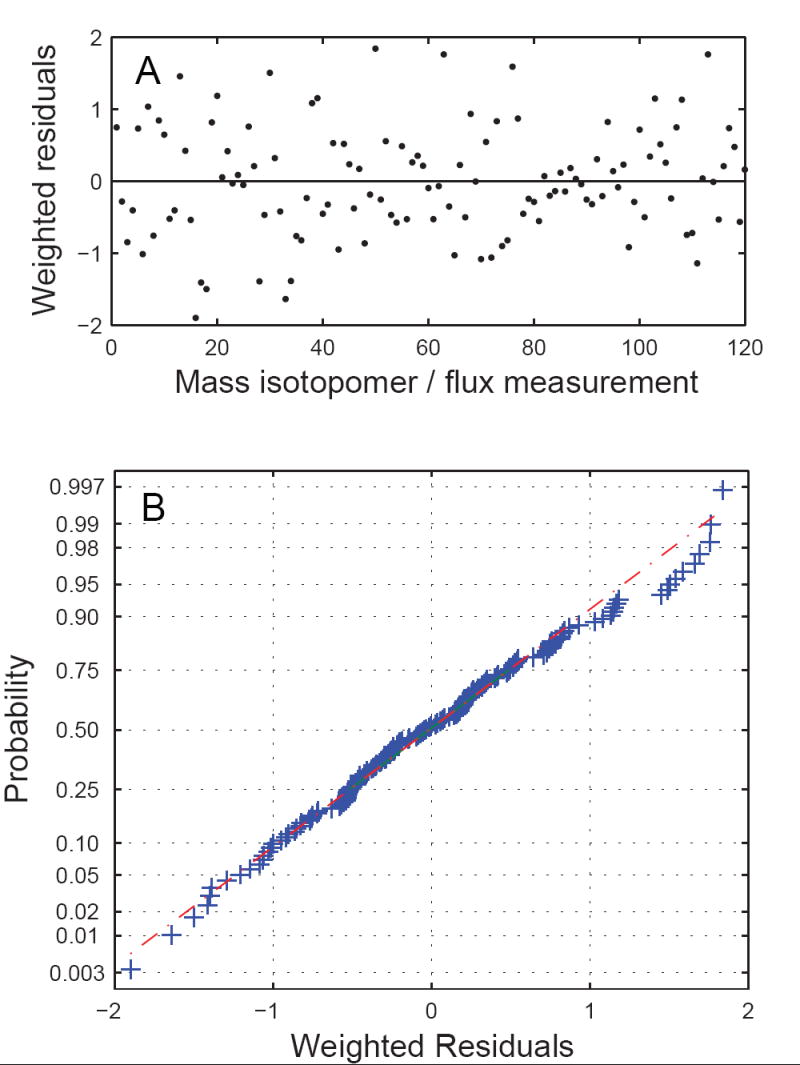
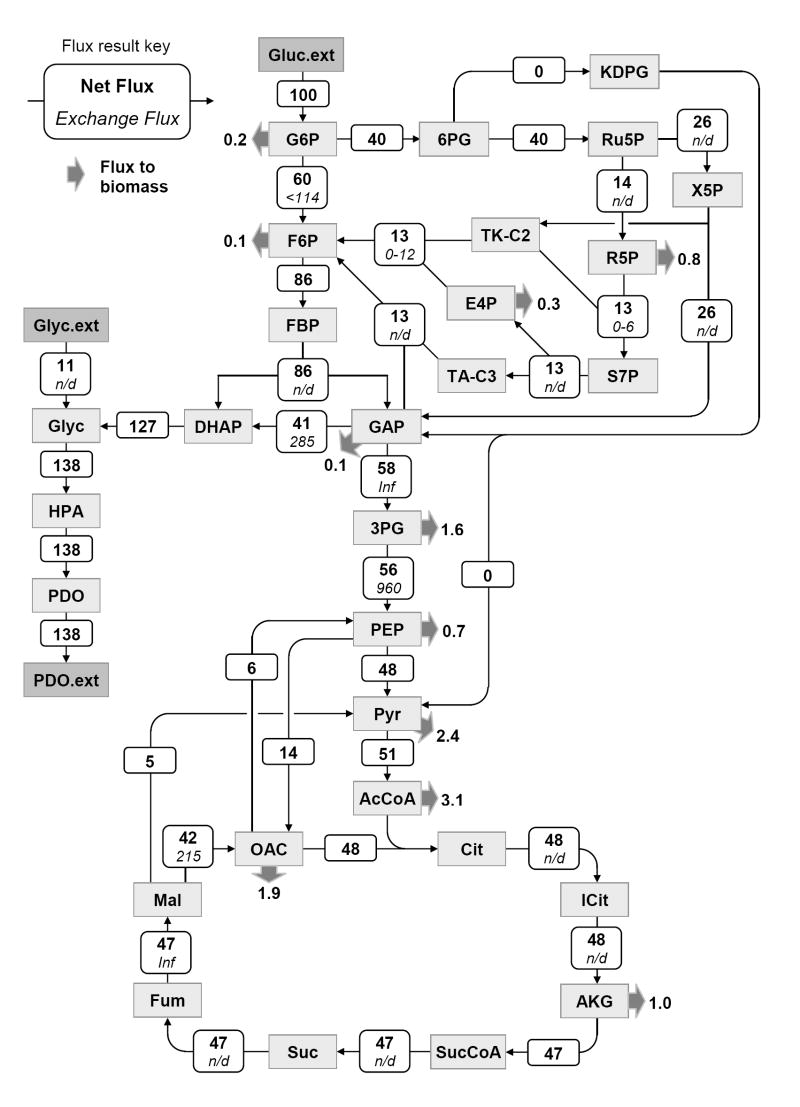
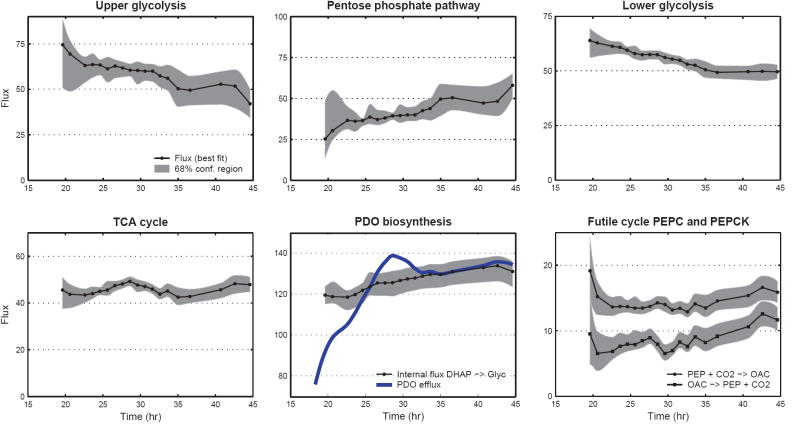
Metabolic fluxes estimated from stable-isotope studies provide a key to understanding cell physiology and regulation of metabolism. A limitation of the classical method for metabolic flux analysis (MFA) is the requirement for isotopic steady state. To extend the scope of flux determination from stationary to nonstationary systems, we present a novel modeling strategy that combines key ideas from isotopomer spectral analysis (ISA) and stationary MFA. Isotopic transients of the precursor pool and the sampled products are described by two parameters, D and G parameters, respectively, which are incorporated into the flux model. The G value is the fraction of labeled product in the sample, and the D value is the fractional contribution of the feed for the production of labeled products. We illustrate the novel modeling strategy with a nonstationary system that closely resembles industrial production conditions, i.e. fed-batch fermentation of Escherichia coli that produces 1,3-propanediol (PDO). Metabolic fluxes and the D and G parameters were estimated by fitting labeling distributions of biomass amino acids measured by GC/MS to a model of E. coli metabolism. We obtained highly consistent fits from the data with 82 redundant measurements. Metabolic fluxes were estimated for 20 time points during course of the fermentation. As such we established, for the first time, detailed time profiles of in vivo fluxes. We found that intracellular fluxes changed significantly during the fed-batch. The intracellular flux associated with PDO pathway increased by 10%. Concurrently, we observed a decrease in the split ratio between glycolysis and pentose phosphate pathway from 70/30 to 50/50 as a function of time. The TCA cycle flux, on the other hand, remained constant throughout the fermentation. Furthermore, our flux results provided additional insight in support of the assumed genotype of the organism.


Figures

Figure 1
Figure 1
Characterization of external fluxes as a function of the fermentation time. (A) Calculated net uptake and consumption rates (mmol/h). Negative fluxes correspond to consumption rates. (B) Biomass specific external fluxes (mmol/h/gDW). (C) Fluxes normalized to glucose uptake rate.
Figure 2
Figure 2
Isotopic composition of glucose in the fermentor as a function of fermentation time measured by GC/MS. 13C-Labeled glucose feed was introduced between 18.6 and 30.0 hr. The composition of glucose reached isotopic steady state for samples between 23.6 and 29.6 hr, with 75.4 mol% [1-13C]glucose and 24.6 mol% [U-13C]glucose. The dashed lines correspond to predicted composition of glucose based on Eq. 7.
Figure 3
Figure 3
Time profiles of isotopic enrichment of four metabolite pools in the pathway from glucose feed to biomass. 13C-Labeled glucose was introduced between 18.6 hr and 30.0 hr. The first isotopic transient is observed for glucose in the fermentor with a characteristic time of about 1 hr. The labeling of carbon dioxide in the off-gas followed closely the labeling of glucose, which suggested pseudo steady-state for intracellular metabolites. The labeling of biomass amino acids never reached isotopic steady state. The characteristic time for biomass amino acids was about 5 to 10 hr.
Figure 4
Figure 4
Model for the analysis of nonstationary tracer experiments. We identify two dilution effects, i.e. dilution of the tracer (glucose), and dilution of the sampled pools (biomass amino acids). The labeling of glucose during the labeling period is a mixture of 13C-labeled glucose feed and natural glucose. The D parameter reflects the contribution of feed glucose to intracellular glucose. The G parameter corresponds to the fraction of 13C-labeled amino acids in the biomass samples, and 1-G is the fraction of natural biomass.
Figure 5
Figure 5
Evaluation of goodness-of-fit for models with and without D and G parameters. Shown is the minimized variance-weighted sum of squared residuals (SSRES) for 20 sample points. The shaded area indicates the statistically acceptable 95% confidence region for SSRES. Models lacking the D or G parameters were statistically not acceptable. Only the model that included both parameters produced statistically acceptable fits for all sample points.
Figure 6
Figure 6
Statistical evaluation of the standard-deviation weighted residuals for sample #12 (taken at 29.6 hr). (A) Weighted residuals of mass isotopomer and external flux measurements. (B) Normal probability plot indicated that the weighted residuals were normally distributed.
Figure 7
Figure 7
Metabolic fluxes of E. coli grown in carbon-limited fed-batch culture. Shown are the estimated fluxes for sample point #12 (at 29.6 hr), normalized to glucose uptake rate. Metabolic fluxes were determined by fitting 112 mass isotopomer abundances and 7 external fluxes to a network model of E. coli. The top number denotes the estimated net flux and the bottom is the estimated exchange flux (in italics); ‘n/d’ indicates that the exchange flux was not observable. Thick arrows represent drain of metabolites to biomass.
Figure 8
Figure 8
Time profiles of selected intracellular fluxes. The best fit (solid line) and the 68% confidence interval (i.e., flux ±SD; shaded area) are shown as a function of fermentation time. Fluxes were normalized to glucose uptake rate. The upper glycolysis flux (G6P→F6P) and lower glycolysis flux (GAP→3PG) decreased in time, while the pentose phosphate pathway flux (G6P→Ru5P) increased. The TCA flux was constant at 46 ± 2. The intracellular flux towards glycerol and PDO (DHAP→glycerol 3-phosphate) increased by 10% from 120±6 to 132±6, whereas the efflux of PDO fluctuated significantly. The simultaneous activity of PEPC and PEPCK created a futile cycle where 1 ATP was lost at each turn of the cycle.
Figure 9
Figure 9
Time profiles of the estimated and predicted D and G parameters. The dots represent estimated D and G parameters from MFA. The G values for individual amino acids (dashed lines in right panel) were not significantly different from one another, indicating that one G value could be used for all biomass amino acids. The solid line represents the predicted parameter values based on Eqs. 8 and 9. The good agreement between the predicted and estimated parameter values supports the validity of our modeling approach.

References

    1. Antoniewicz MR, Kelleher JK, Stephanopoulos G. Accurate assessment of amino acid mass isotopomer distributions for metabolic flux analysis. 2006a submitted to Anal Chem. - PubMed
    1. Antoniewicz MR, Kelleher JK, Stephanopoulos G. Determination of confidence intervals of metabolic fluxes estimated from stable isotope measurements. Metab Eng. 2006b;8:324–337. - PubMed
    1. Antoniewicz MR, Kelleher JK, Stephanopoulos G. Elementary Metabolite Units (EMU): a novel framework for modeling isotopic distributions. Metab Eng. 2007;9:68–86. - PMC - PubMed
    1. Brunengraber H, Kelleher JK, Des RC. Applications of mass isotopomer analysis to nutrition research. Annu Rev Nutr. 1997;17:559–596. - PubMed
    1. Dauner M, Sauer U. GC-MS analysis of amino acids rapidly provides rich information for isotopomer balancing. Biotechnol Prog. 2000;16:642–649. - PubMed

Publication types

MeSH terms