Low-resolution structure and fluorescence anisotropy analysis of protein tyrosine phosphatase eta catalytic domain
- PMID: 17400699
- PMCID: PMC1877755
- DOI: 10.1529/biophysj.106.094961
Low-resolution structure and fluorescence anisotropy analysis of protein tyrosine phosphatase eta catalytic domain
Abstract
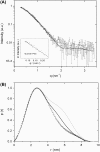
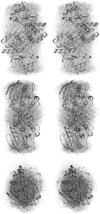
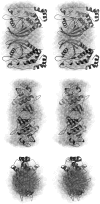
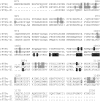
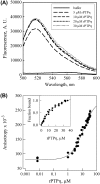
The rat protein tyrosine phosphatase eta, rPTPeta, is a class I "classical" transmembrane RPTP, with an intracellular portion composed of a unique catalytic region. The rPTPeta and the human homolog DEP-1 are downregulated in rat and human neoplastic cells, respectively. However, the malignant phenotype is reverted after exogenous reconstitution of rPTPeta, suggesting that its function restoration could be an important tool for gene therapy of human cancers. Using small-angle x-ray scattering (SAXS) and biophysical techniques, we characterized the intracellular catalytic domain of rat protein tyrosine phosphatase eta (rPTPetaCD) in solution. The protein forms dimers in solution as confirmed by SAXS data analysis. The SAXS data also indicated that rPTPetaCD dimers are elongated and have an average radius of gyration of 2.65 nm and a D(max) of 8.5 nm. To further study the rPTPetaCD conformation in solution, we built rPTPetaCD homology models using as scaffolds the crystallographic structures of RPTPalpha-D1 and RPTPmicro-D1 dimers. These models were, then, superimposed onto ab initio low-resolution SAXS structures. The structural comparisons and sequence alignment analysis of the putative dimerization interfaces provide support to the notion that the rPTPetaCD dimer architecture is more closely related to the crystal structure of autoinhibitory RPTPalpha-D1 dimer than to the dimeric arrangement exemplified by RPTPmicro-D1. Finally, the characterization of rPTPetaCD by fluorescence anisotropy measurements demonstrates that the dimer dissociation is concentration dependent with a dissociation constant of 21.6 +/- 2.0 microM.
Figures

Similar articles
-
The structure of the membrane distal phosphatase domain of RPTPalpha reveals interdomain flexibility and an SH2 domain interaction region.Biochemistry. 2003 Jul 8;42(26):7904-14. doi: 10.1021/bi0340503. Biochemistry. 2003. PMID: 12834342
-
The phosphatase domains of LAR, CD45, and PTP1B: structural correlations with peptide-based inhibitors.Biochem Cell Biol. 2000;78(1):39-50. Biochem Cell Biol. 2000. PMID: 10735562
-
Reversible oxidation of the membrane distal domain of receptor PTPalpha is mediated by a cyclic sulfenamide.Biochemistry. 2007 Jan 23;46(3):709-19. doi: 10.1021/bi061546m. Biochemistry. 2007. PMID: 17223692
-
Restoration of potent protein-tyrosine phosphatase activity into the membrane-distal domain of receptor protein-tyrosine phosphatase alpha.Biochemistry. 1999 Jan 19;38(3):914-22. doi: 10.1021/bi981936b. Biochemistry. 1999. PMID: 9893986
-
Receptor protein tyrosine phosphatase micro: measuring where to stick.Biochem Soc Trans. 2008 Apr;36(Pt 2):167-72. doi: 10.1042/BST0360167. Biochem Soc Trans. 2008. PMID: 18363557 Review.
Cited by
-
Preparation and characterization of PEGylated amylin.AAPS PharmSciTech. 2013 Sep;14(3):1083-97. doi: 10.1208/s12249-013-9987-4. Epub 2013 Jul 2. AAPS PharmSciTech. 2013. PMID: 23818080 Free PMC article.
-
Clustering of phosphatase RPTPα promotes Src signaling and the arthritogenic action of synovial fibroblasts.Sci Signal. 2023 Jul 4;16(792):eabn8668. doi: 10.1126/scisignal.abn8668. Epub 2023 Jul 4. Sci Signal. 2023. PMID: 37402225 Free PMC article.
-
Disrupting PTPRJ transmembrane-mediated oligomerization counteracts oncogenic receptor tyrosine kinase FLT3 ITD.Front Oncol. 2022 Nov 14;12:1017947. doi: 10.3389/fonc.2022.1017947. eCollection 2022. Front Oncol. 2022. PMID: 36452504 Free PMC article.
-
Dissecting the Relation between a nuclear receptor and GATA: binding affinity studies of thyroid hormone receptor and GATA2 on TSHβ promoter.PLoS One. 2010 Sep 7;5(9):e12628. doi: 10.1371/journal.pone.0012628. PLoS One. 2010. PMID: 20838640 Free PMC article.
-
Reactive oxygen species and epidermal growth factor are antagonistic cues controlling SHP-2 dimerization.Mol Cell Biol. 2012 May;32(10):1998-2009. doi: 10.1128/MCB.06674-11. Epub 2012 Mar 12. Mol Cell Biol. 2012. PMID: 22411627 Free PMC article.
References
-
- Hunter, T. 1987. A 1001 protein-kinases. Cell. 50:823–829. - PubMed
-
- Hunter, T. 1995. Protein-kinases and phosphatases: the Yin and Yang of protein-phosphorylation and signaling. Cell. 80:225–236. - PubMed
-
- Tonks, N. K., and B. G. Neel. 1996. From form to function: signaling by protein tyrosine phosphatases. Cell. 87:365–368. - PubMed
-
- Neel, B. G., and N. K. Tonks. 1997. Protein tyrosine phosphatases in signal transduction. Curr. Opin. Cell Biol. 9:193–204. - PubMed
-
- Chagnon, M. J., N. Uetani, and M. L. Tremblay. 2004. Functional significance of the LAR receptor protein tyrosine phosphatase family in development and diseases. Biochem. Cell Biol. 82:664–675. - PubMed
Publication types
MeSH terms
Substances
LinkOut - more resources
Full Text Sources

