. 2007 Jun 15;92(12):4137-44.
doi: 10.1529/biophysj.106.100206. Epub 2007 Mar 30.

Tracking single Kinesin molecules in the cytoplasm of mammalian cells

Affiliations

Tracking single Kinesin molecules in the cytoplasm of mammalian cells

Dawen Cai et al. Biophys J. .

Abstract

Understanding dynamic cellular processes requires precise knowledge of the distribution, transport, and interactions of individual molecules in living cells. Despite recent progress in in vivo imaging, it has not been possible to express and directly track single molecules in the cytoplasm of live cells. Here, we overcome these limitations by combining fluorescent protein-labeling with high resolution total internal reflection fluorescence microcopy, using the molecular motor Kinesin-1 as model system. First, we engineered a three-tandem monomeric Citrine tag for genetic labeling of individual molecules and expressed this motor in COS cells. Detailed analysis of the quantized photobleaching behavior of individual fluorescent spots demonstrates that we are indeed detecting single proteins in the cytoplasm of live cells. Tracking the movement of individual cytoplasmic molecules reveals that individual Kinesin-1 motors in vivo move with an average speed of 0.78 +/- 0.11 microm/s and display an average run length of 1.17 +/- 0.38 microm, which agrees well with in vitro measurements. Thus, Kinesin-1's speed and processivity are not upregulated or hindered by macromolecular crowding. Second, we demonstrate that standard deviation maps of the fluorescence intensity computed from single molecule image sequences can be used to reveal important physiological information about infrequent cellular events in the noisy fluorescence background of live cells. Finally, we show that tandem fluorescent protein tags enable single-molecule, in vitro analyses of extracted, mammalian-expressed proteins. Thus, by combining direct genetic labeling and single molecule imaging in vivo, our work establishes an important new biophysical method for observing single molecules expressed and localized in the mammalian cytoplasm.


Figures
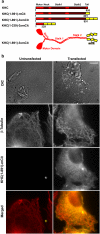
FIGURE 1
FIGURE 1
COS expression system for tracking single kinesin-1 motors in live cells. (a) Schematic of KHC fusion proteins. One or three monomeric Citrine (mCit) fluorescent protein tags were fused to the C-terminus of homodimeric KHC(1-891) or monomeric KHC(1-339). (b) Epi-fluorescence microscopy of fixed COS cells expressing KHC(1-891)-mCit (right panels) or untransfected (left panels). The flat morphology of the COS cell periphery can be seen by DIC microscopy. The microtubule tracks were stained with an anti-tubulin antibody. The expressed KHC(1-891)-mCit can be seen in the mCit channel. (Bottom panels) Merged anti-tubulin and mCit images. Scale bar = 10 μm.
FIGURE 2
FIGURE 2
Single molecule tracking of mCit-labeled KHC motors in live COS cells. TIRFM of COS cells expressing panels ad, KHC(1-891)-mCit; panels eh, KHC(1-891)-3×mCit; and panels il, KHC(1-339)-3×mCit. (a,e,i) Field of view of TIRFM near the periphery of the cells. The edges of the cells are outlined. (b,f,j) Kymographs of the boxed areas in panels a, e, and i, respectively. Scale bars, 2 μm and, 0.2 s. The homodimeric kinesin-1 motors KHC(1-891)-mCit (b) and KHC(1-891)-3×mCit (f) move processively, whereas the monomeric motor KHC(1-339)-3×mCit (j) does not. The presence of two mCit FPs in KHC(1-891)-mCit (a) results in loss of signal due to blinking and photobleaching whereas the six mCit FPs in KHC(1-891)-3×mCit (f) are brighter and unlikely to blink to background before complete photobleaching. (c,g,k) Representative traces of quantized photobleaching. mCit-labeled KHC molecules were locked on microtubules by the addition of AMPPNP to prevent diffusion or motility. Stepwise photobleaching and the number of bleaching steps indicate the present of single KHC motors in the light diffraction-limited areas. (d,h,l) Standard deviation maps of the image series shown in panels a, e, and i, respectively. By deemphasizing the fluorescence background and emphasizing the motility events, the standard deviation maps highlight the microtubule tracks utilized for motility. Processive, linear motility can be seen for the homodimeric kinesin-1 motors KHC(1-891)-mCit (d) and KHC(1-891)-3×mCit (h) but not the monomeric motor KHC(1-339)-3×mCit (l).
FIGURE 3
FIGURE 3
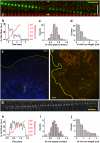
Fluorescence properties of mCit-labeled KHC motors in vitro. Extracts of COS cells expressing panels ac, KHC(1-891)-mCit; panels df, KHC(1-891)-3×mCit; or panels gi, KHC(1-339)-3×mCit were absorbed onto the cover glass and imaged under the same TIRFM conditions as live cell experiments (Fig. 2). (a,d,g) Representative examples of quantized photobleaching of mCit-labeled KHC motors within the light-diffraction-limited fluorescent spots. (b,e,h) Fitting of single exponential decay fitting (solid lines) of the fluorescence bleaching time of mCit-labeled KHC motors showed that the decay time constants are 1.1 ± 0.2 s for KHC(1-891)-mCit (N = 77, b), 2.2 ± 0.3 s for KHC(1-891)-3×mCit (N = 86, e), and 1.8 ± 0.2 s for KHC(1-339)-3×mCit (N = 89, h). (c,f,i) Histograms of the photobleaching events show primarily two steps for KHC(1-891)-mCit (c), four or five bleaching steps for KHC(1-891)-3×mCit (f), and two or three steps for KHC(1-339)-3×mCit (i).
FIGURE 4
FIGURE 4
Motile properties of single KHC(1-891)-3×mCit molecules in vitro and in vivo. (ad) Motile properties of KHC(1-891)-3×mCit in vitro. (a) Taxol-stabilized microtubules, heavily labeled with Cy5-tubulin (red) at their plus ends, were incubated in a BSA-coated flow chamber with KHC(1-891)-3×mCit COS lysate and 1 mM ATP. Kymograph shows one representative fluorescence spot moving processively on a Cy5-labeled microtubule. (b) Graph of displacement (red) and fluorescence intensity (black) over time for the same fluorescence spot shown in panel a. Stepwise photobleaching behavior indicates the presence of one KHC(1-891)-3×mCit in the light-diffraction-limited area. (c) Gaussian fitting of the speed histogram shows that KHC(1-891)-3×mCit motors move at 0.77 ± 0.14 μm/s (N = 54). (d) Single exponential decay fitting of the run length histogram shows the same motors move processively for 0.83 ± 0.29 μm/run. (ej) Motile properties of KHC(1-891)-3×mCit in vivo. (e,f) Merge of final TIRFM image and standard deviation map of COS cells expressing low (e) or moderate (f) levels of KHC(1-891)-3×mCit (Supplementary Material, Movies 5 and 6, respectively). KHC(1-891)-3×mCit (green); standard deviation map of image series (pink or red); cellular autofluorescence background (blue). (g) Kymograph of boxed region of panel e shows KHC(1-891)-3×mCit moving processively. (h) Graph of displacement (red) and fluorescence intensity (black) over time of the same fluorescent spot shown in panel g. (i) Gaussian fitting of the speed histogram shows that KHC(1-891)-3×mCit motors move at 0.78 ± 0.11 μm/s (N = 54). (j) Single exponential decay fitting of the run length histogram shows the same motors move processively for 1.17 ± 0.38 μm/run. White scale bars, 2 μm; yellow scale bars, 0.1 s.

References

    1. Xie, X. S., J. Yu, and W. Y. Yang. 2006. Living cells as test tubes. Science. 312:228–230. - PubMed
    1. Sako, Y., and T. Yanagida. 2003. Single-molecule visualization in cell biology. Nat. Rev. Mol. Cell Biol. Suppl:SS1–5. - PubMed
    1. Schutz, G. J., G. Kada, V. P. Pastushenko, and H. Schindler. 2000. Properties of lipid microdomains in a muscle cell membrane visualized by single molecule microscopy. EMBO J. 19:892–901. - PMC - PubMed
    1. Harms, G. S., L. Cognet, P. H. Lommerse, G. A. Blab, H. Kahr, R. Gamsjager, H. P. Spaink, N. M. Soldatov, C. Romanin, and T. Schmidt. 2001. Single-molecule imaging of l-type Ca2+ channels in live cells. Biophys. J. 81:2639–2646. - PMC - PubMed
    1. Iino, R., I. Koyama, and A. Kusumi. 2001. Single molecule imaging of green fluorescent proteins in living cells: E-cadherin forms oligomers on the free cell surface. Biophys. J. 80:2667–2677. - PMC - PubMed

Publication types

MeSH terms

LinkOut - more resources