. 2007 Mar;19(3):1096-122.
doi: 10.1105/tpc.106.049353. Epub 2007 Mar 30.

Herbivory rapidly activates MAPK signaling in attacked and unattacked leaf regions but not between leaves of Nicotiana attenuata

Affiliations

Herbivory rapidly activates MAPK signaling in attacked and unattacked leaf regions but not between leaves of Nicotiana attenuata

Jianqiang Wu et al. Plant Cell. 2007 Mar.

Abstract

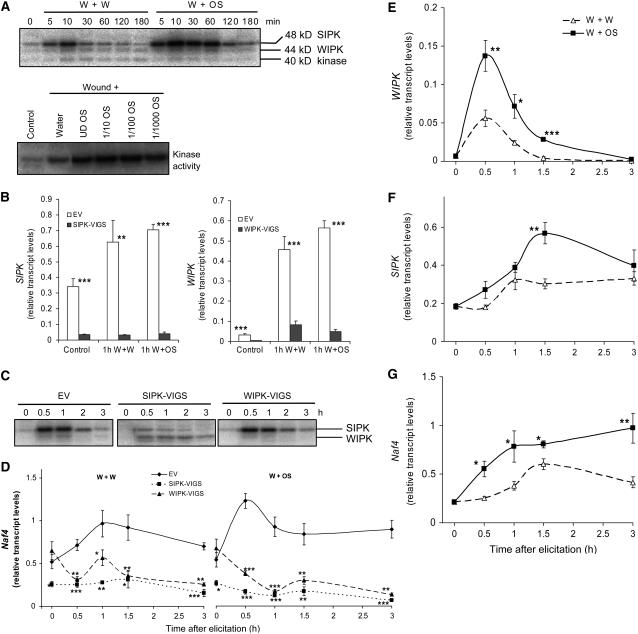
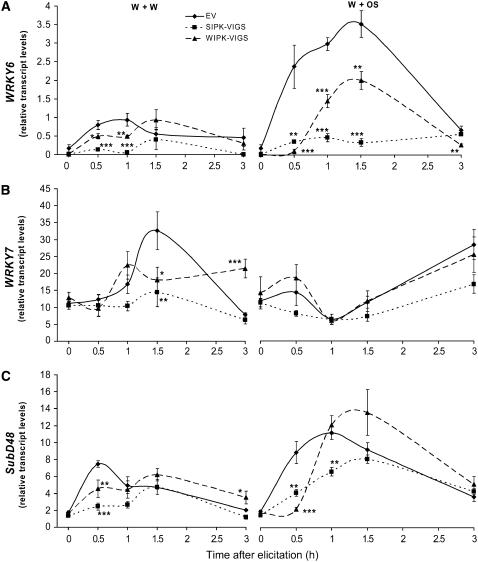
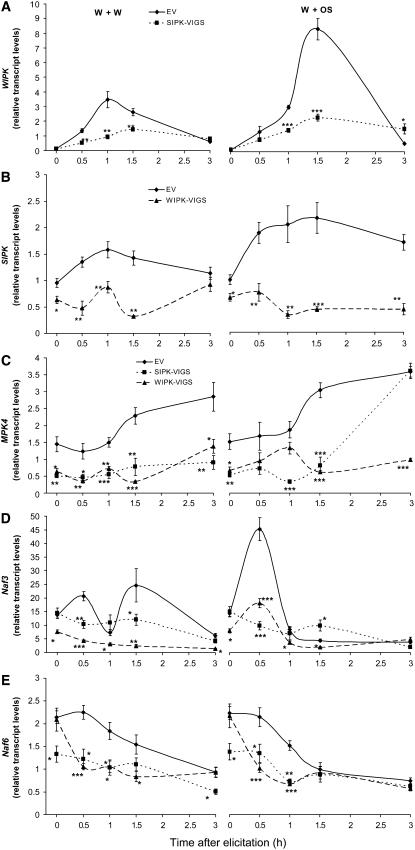
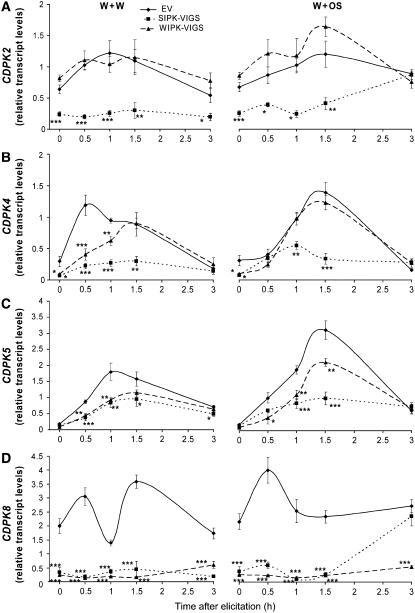
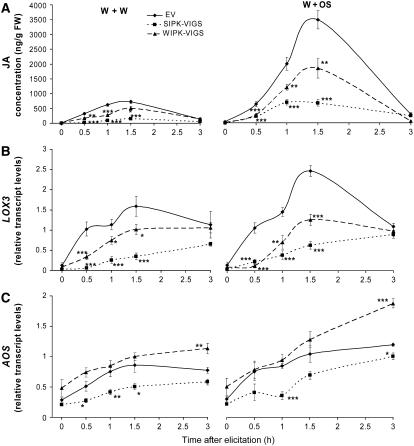
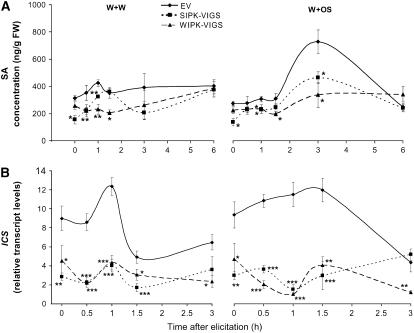
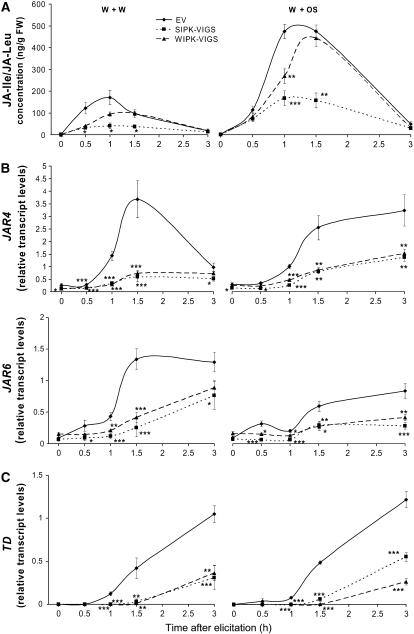
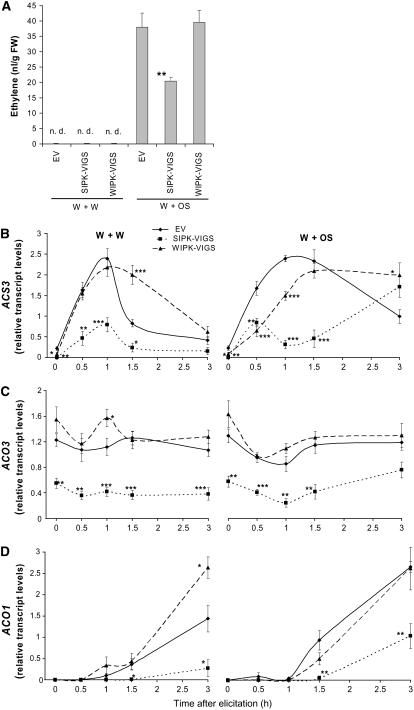
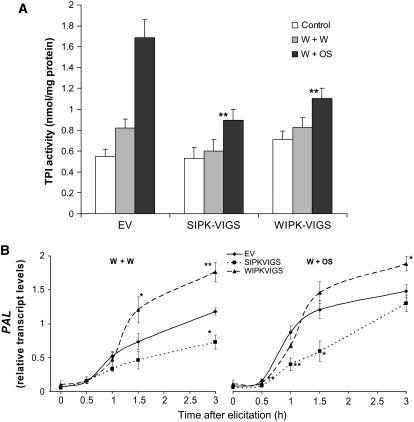
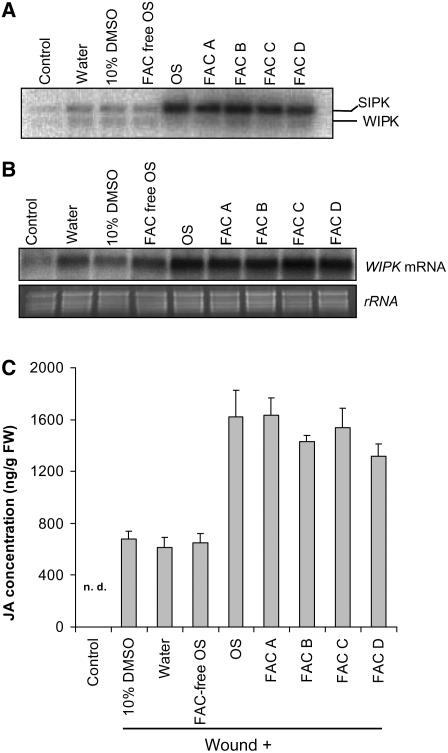
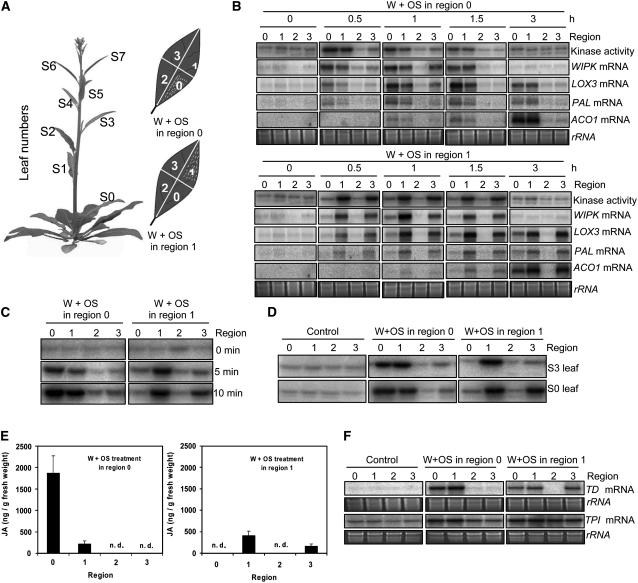
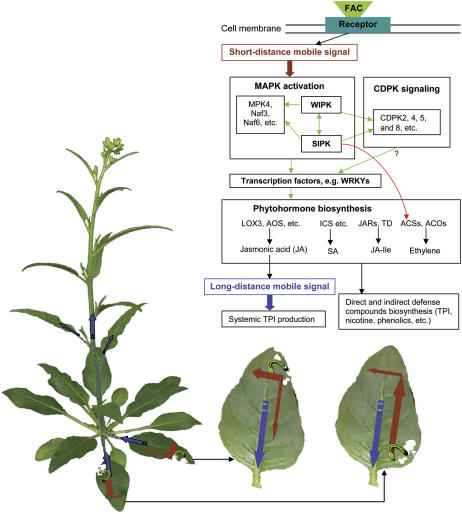
Mitogen-activated protein kinase (MAPK) signaling plays a central role in transducing extracellular stimuli into intracellular responses, but its role in mediating plant responses to herbivore attack remains largely unexplored. When Manduca sexta larvae attack their host plant, Nicotiana attenuata, the plant's wound response is reconfigured at transcriptional, phytohormonal, and defensive levels due to the introduction of oral secretions (OS) into wounds during feeding. We show that OS dramatically amplify wound-induced MAPK activity and that fatty acid-amino acid conjugates in M. sexta OS are the elicitors. Virus-induced gene silencing of salicylic acid-induced protein kinase (SIPK) and wound-induced protein kinase revealed their importance in mediating wound and OS-elicited hormonal responses and transcriptional regulation of defense-related genes. We found that after applying OS to wounds created in one portion of a leaf, SIPK is activated in both wounded and specific unwounded regions of the leaf but not in phylotactically connected adjacent leaves. We propose that M. sexta attack elicits a mobile signal that travels to nonwounded regions of the attacked leaf where it activates MAPK signaling and, thus, downstream responses; subsequently, a different signal is transported by the vascular system to systemic leaves to initiate defense responses without activating MAPKs in systemic leaves.


Figures

Figure 1.
Figure 1.
Applying M. sexta OS to N. attenuata Leaves Activates MAPKs. (A) Top panel: N. attenuata leaves were wounded with a pattern wheel; 20 μL of water (W+W) or M. sexta OS (1/5-diluted) (W+OS) was applied to the wounds, and leaves from four replicate plants were harvested at the indicated times. Bottom panel: 20 μL of water, undiluted OS (UD OS), 1/10-, 1/100-, and 1/1000-diluted OS was applied to wounds, and leaves from four replicate plants were harvested after 30 min. Kinase activity was analyzed by an in-gel kinase assay using myelin basic protein (MBP) as the substrate. (B) N. attenuata plants were infiltrated with Agrobacterium carrying pTV00 EV or constructs harboring a fragment of SIPK or WIPK to generate EV, SIPK-VIGS, and WIPK-VIGS plants, respectively. Mean (+se) levels of SIPK and WIPK transcripts in SIPK-VIGS and WIPK-VIGS plants were measured with q-PCR using five replicate untreated (control) and 1 h W+W- and W+OS-treated samples. (C) EV, SIPK-VIGS, and WIPK-VIGS plants were treated with W+OS and collected at indicated times; five replicate samples were pooled and MAPK activity was detected with an in-gel kinase assay. (D) Mean transcript levels (±se) of Naf4 in EV, SIPK-VIGS, and WIPK-VIGS plants after W+W and W+OS treatments as measured with q-PCR. Asterisks represent significantly different transcript levels between EV and VIGS plants at the indicated times (n = 5, two-way analysis of variance [ANOVA], Fisher's protected least-square difference (PLSD); *, P < 0.05; **, P < 0.01; ***, P < 0.001). (E) to (G) Mean transcript levels (±se) of WIPK, SIPK, and Naf4 after W+W and W+OS treatments as measured with q-PCR in wild-type N. attenuata. Asterisks represent significant differences between transcript levels in samples treated with W+OS and W+W at the indicated times (n = 5, unpaired t test; *, P < 0.05; **, P < 0.01; ***, P < 0.001).
Figure 2.
Figure 2.
SIPK and WIPK Regulate Transcript Accumulation of WRKY Genes. N. attenuata plants were inoculated with Agrobacterium carrying pTV00 EV or constructs harboring a fragment of SIPK or WIPK to generate EV, SIPK-VIGS, and WIPK-VIGS plants, respectively. Leaves were wounded with a pattern wheel; 20 μL of either water (W+W) or M. sexta OS and regurgitants (W+OS) was applied to the wounds and harvested at the indicated times. Mean levels (±se) from five replicate plants of WRKY6 (A), WRKY7 (B), and SubD48 (C) transcripts in EV, SIPK-VIGS, and WIPK-VIGS plants after W+W and W+OS treatments were measured with q-PCR. Asterisks represent significantly different transcript levels between EV and SIPK-VIGS or WIPK-VIGS plants after the indicated times (n = 5, two-way ANOVA, Fisher's PLSD; *, P < 0.05; **, P < 0.01; ***, P < 0.001).
Figure 3.
Figure 3.
SIPK and WIPK Regulate Transcript Accumulation of MAPKs. N. attenuata plants were inoculated with Agrobacterium carrying pTV00 EV or constructs harboring a fragment of SIPK or WIPK to generate EV, SIPK-VIGS, and WIPK-VIGS plants, respectively. Leaves were wounded with a pattern wheel; 20 μL of either water (W+W) or M. sexta OS (W+OS) was applied to the wounds. Individual leaves from five replicate plants were harvested at the indicated times. Asterisks represent significantly different transcript levels between EV and VIGS plants at the indicated times ([A] and [B], unpaired t test; [C] to [E], two-way ANOVA, Fisher's PLSD; *, P < 0.05; **, P < 0.01; ***, P < 0.001). (A) Mean WIPK transcript levels (±se) in EV and SIPK-VIGS plants after W+W and W+OS treatments as measured with q-PCR. (B) Mean transcript levels (±se) of SIPK in EV and WIPK-VIGS plants after W+W and W+OS treatments as measured with q-PCR. (C) to (E) Mean transcript levels (±se) of MPK4, Naf3, and Naf6 in EV, SIPK-VIGS, and WIPK-VIGS plants after W+W and W+OS treatments, respectively, as measured with q-PCR.
Figure 4.
Figure 4.
SIPK and WIPK Mediate Transcript Accumulation of CDPKs. N. attenuata plants were inoculated with Agrobacterium carrying pTV00 EV or constructs harboring a fragment of SIPK or WIPK to generate EV, SIPK-VIGS, and WIPK-VIGS plants, respectively. Leaves were wounded with a pattern wheel; 20 μL of either water (W+W) or M. sexta OS (W+OS) was applied to the wounds. Individual leaves from five replicate plants were harvested at the indicated times. Mean (±se) transcript levels in five replicate plants of CDPK2 (A), CDPK4 (B), CDPK5 (C), and CDPK8 (D) in EV, SIPK-VIGS, and WIPK-VIGS plants after W+W and W+OS treatments were measured with q-PCR. Asterisks represent significantly different transcript levels between EV and SIPK-VIGS or WIPK-VIGS plants after the indicated times (two-way ANOVA, Fisher's PLSD; *, P < 0.05; **, P < 0.01; ***, P < 0.001).
Figure 5.
Figure 5.
SIPK and WIPK Mediate Levels of JA and Transcript Accumulation of JA Biosynthetic Genes. N. attenuata plants were inoculated with Agrobacterium carrying pTV00 EV or constructs harboring a fragment of SIPK or WIPK to generate EV, SIPK-VIGS, and WIPK-VIGS plants, respectively. Leaves were wounded with a pattern wheel; 20 μL of either water (W+W) or M. sexta OS (W+OS) was applied to the wounds. Individual leaves from five replicate plants were harvested at the indicated times. Asterisks represent significantly different levels between EV and SIPK-VIGS or WIPK-VIGS plants after the indicated times (two-way ANOVA, Fisher's PLSD; *, P < 0.05; **, P < 0.01; ***, P < 0.001). (A) Mean (±se) JA concentrations were measured using HPLC–tandem mass spectrometry (MS/MS). FW, fresh weight. (B) and (C) Mean transcript levels (±se) of LOX3 and AOS as measured with q-PCR.
Figure 6.
Figure 6.
SIPK and WIPK Mediate Levels of SA and Transcript Levels of ICS. N. attenuata plants were inoculated with Agrobacterium carrying pTV00 EV or constructs harboring a fragment of SIPK or WIPK to generate EV, SIPK-VIGS, and WIPK-VIGS plants, respectively. Leaves were wounded with a pattern wheel; 20 μL of either water (W+W) or M. sexta OS (W+OS) was applied to the wounds. Individual leaves from five replicate plants were harvested at the indicated times after elicitation. Asterisks represent significantly different levels between EV and SIPK-VIGS or WIPK-VIGS plants at the indicated times (two-way ANOVA, Fisher's PLSD; *, P < 0.05; **, P < 0.01; ***, P < 0.001). (A) Mean (±se) SA concentrations were measured using HPLC-MS/MS. (B) Mean transcript levels (±se) of ICS in EV, SIPK-VIGS, and WIPK-VIGS plants after W+W and W+OS treatments were measured with q-PCR.
Figure 7.
Figure 7.
SIPK and WIPK Mediate Levels of JA-Ile/JA-Leu and Transcript Levels of Genes Involved in JA-Ile/JA-Leu Biosynthesis. N. attenuata plants were inoculated with Agrobacterium carrying pTV00 EV or constructs harboring a fragment of SIPK or WIPK to generate EV, SIPK-VIGS, and WIPK-VIGS plants, respectively. Leaves were wounded with a pattern wheel; 20 μL of either water (W+W) or M. sexta OS (W+OS) was applied to the wounds. Individual leaves from five replicate plants were harvested at the indicated times after elicitation. Asterisks represent significantly different transcript levels between EV and SIPK-VIGS or WIPK-VIGS plants at the indicated times (two-way ANOVA, Fisher's PLSD; *, P < 0.05; **, P < 0.01; ***, P < 0.001). (A) Mean (±se) JA-Ile/JA-Leu concentrations were measured using HPLC-MS/MS. (B) and (C) Mean transcript levels (±se) of JAR4, JAR6, and TD in EV, SIPK-VIGS, and WIPK-VIGS plants after W+W and W+OS treatments as measured with q-PCR.
Figure 8.
Figure 8.
SIPK but Not WIPK Mediates Ethylene Biosynthesis. N. attenuata plants were infiltrated with Agrobacterium carrying pTV00 EV or constructs harboring a fragment of SIPK or WIPK to generate EV, SIPK-VIGS, and WIPK-VIGS plants, respectively. Asterisks represent significant differences between EV and SIPK-VIGS or WIPK-VIGS plants (two-way ANOVA, Fisher's PLSD; *, P < 0.05; **, P < 0.01; ***, P < 0.001). (A) Mean (±se) ethylene accumulated. Leaves were wounded with a pattern wheel; 20 μL of water (W+W) or M. sexta OS (W+OS) was applied to the wounds, and leaf samples were collected in 250-mL flasks. After 5 h, ethylene produced in four replicates was measured with a photoacoustic laser spectrometer. n.d., not detected. (B) to (D) Leaves were wounded with a pattern wheel; 20 μL of water (W+W) or M. sexta OS (W+OS) was applied to the wounds. Individual leaf samples from five replicate plants were harvested at indicated times. Average transcript levels (±se) of ACS3, ACO3, and ACO1 in EV, SIPK-VIGS, and WIPK-VIGS plants after W+W and W+OS treatments were measured with q-PCR.
Figure 9.
Figure 9.
SIPK and WIPK Mediate Levels of TPI Activity and Transcript Levels of PAL. N. attenuata plants were inoculated with Agrobacterium carrying pTV00 EV or constructs harboring a fragment of SIPK or WIPK to generate EV, SIPK-VIGS, and WIPK-VIGS plants, respectively. Asterisks represent significant differences between EV and SIPK-VIGS or WIPK-VIGS plants after the specific treatments (n = 5, two-way ANOVA, Fisher's PLSD; *, P < 0.05; **, P < 0.01; ***, P < 0.001). (A) Mean (+se) TPI activity in EV, SIPK-VIGS, and WIPK-VIGS plants. Leaves were wounded with a pattern wheel; 20 μL of either water (W+W) or M. sexta OS (W+OS) was applied to the wounds, and leaves from five replicate plants were harvested individually 3 d after treatments. Untreated plants served as controls. (B) Mean transcript levels (±se) of PAL in EV, SIPK-VIGS, and WIPK-VIGS plants after W+W and W+OS treatments as measured with q-PCR. Leaves were wounded with a pattern wheel; 20 μL of either water (W+W) or M. sexta OS (W+OS) was applied to the wounds.
Figure 10.
Figure 10.
FACs in M. sexta OS Elicit MAPK Activity and JA Burst. N. attenuata leaves were wounded with a pattern wheel, and 20 μL of the following solutions was immediately applied to the puncture wounds: water, 10% DMSO, FAC-free OS, OS, and FAC A, B, C, and D dissolved in 10% DMSO. Untreated and unwounded plants were used as controls. (A) Four replicate samples were harvested 30 min after each treatment and pooled; an in-gel kinase assay was performed to test each treatment's ability to activate MAPKs. (B) Total RNA was extracted from samples 1 h after elicitation; WIPK transcript accumulation was determined by RNA gel blotting from four pooled replicates. (C) Mean (+se) JA concentrations in five replicate leaf samples 1 h after elicitation were measured by HPLC-MS/MS. n.d., not detected.
Figure 11.
Figure 11.
Spatial Distribution of OS-Elicited Responses within Single Leaves Growing at Different Nodes. Experiments were conducted on leaves growing at either S0 or S3 nodes from 40-d-old bolting wild-type N. attenuata plants. Four replicate leaves from different plants were used for each treatment. (A) Numbering of the leaves at different phyllotaxic positions (nodes) on bolting plants and illustration of treatments at different leaf regions. Wounds are illustrated with dotted lines; each leaf was wounded with a pattern wheel, and 10 μL M. sexta OS (W+OS) was applied to either region 0 or 1. Leaves were harvested in four sections at the specified times. (B) Spatial distribution of W+OS-elicited responses in S0 leaves. Total protein and RNA were extracted from S0 leaves. Kinase activity was determined by an in-gel kinase assay using MBP as the substrate. Transcript levels of WIPK, LOX3, PAL, and ACO1 were examined with RNA gel blotting. (C) Spatial distribution of W+OS-elicited SIPK activity in S0 leaves shortly after elicitation. S0 leaves were treated with W+OS; after 5 and 10 min, samples were collected. Kinase activity was analyzed using an in-gel assay. (D) Spatial distribution of W+OS-elicited SIPK activity in S0 and S3 leaves. Both S0 and S3 leaves were treated with W+OS and harvested after 30 min. The spatial distribution of kinase activity was analyzed by an in-gel kinase assay. (E) Mean (+se) JA concentrations in four replicate S0 leaf samples collected 1 h after W+OS treatment. n.d., not detected. (F) In W+OS-treated S0 leaves, the accumulation of TD and TPI transcripts after 3 h and 12 h, respectively, was determined by RNA gel blotting.
Figure 12.
Figure 12.
TPI Transcript Accumulation in Systemic Leaves Doesn't Require Activating SIPK in Systemic Leaves. Leaves at node +1 from rosette-stage N. attenuata were wounded with a pattern wheel; 20 μL of M. sexta OS (OS) was applied to the wounds. Treated leaves (+1, local) and systemic untreated leaves (−1) were harvested at indicated times. Four replicate leaves were pooled after harvesting. (A) Kinase activity assay in both local and systemic leaves after elicitation. (B) Transcript accumulation analyses of WIPK and TPI in local and systemic leaves by RNA gel blotting.
Figure 13.
Figure 13.
Model Summarizing How OS-Elicited Responses Activate Defenses in Local and Systemic Leaves of N. attenuata. After attack from M. sexta larvae, FACs in the larvae's OS bind to hypothetical receptors in the cell membranes and activate a short-distance mobile signal that enhances SIPK and WIPK activity in both wounded regions and, in particular, nonwounded adjacent regions in the leaf. Afterwards, activating SIPK and WIPK leads to the transcriptional regulation of other MAPKs, CDPKs, and transcription factors, such as WRKYs. Through WRKY and other transcription factors, both kinases subsequently enhance transcript levels of genes involved in JA, SA, JA-Ile, and ethylene biosynthesis, which in turn enhance levels of JA, SA, JA-Ile, and ethylene. SIPK may also directly phosphorylate some of these genes' protein products (for example, ACS) and thus enhance their activity. A long-distance mobile signal, such as JA or a JA-elicited substance, moves through the vascular system to distal leaves and enhances both local and systemic levels of TPI activity. Green arrows represent regulation at transcriptional levels; red arrows represent direct phosphorylation; arrows in brown and blue represent short- and long-distance mobile signals, respectively.

Similar articles

Cited by

References

    1. Ahlfors, R., Macioszek, V., Rudd, J., Brosche, M., Schlichting, R., Scheel, D., and Kangasjarvi, J. (2004). Stress hormone-independent activation and nuclear translocation of mitogen-activated protein kinases in Arabidopsis thaliana during ozone exposure. Plant J. 40 512–522. - PubMed
    1. Alarcon, J.J., and Malone, M. (1994). Substantial hydraulic signals are triggered by leaf-biting insects in tomato. J. Exp. Bot. 45 953–957.
    1. Alborn, H.T., Brennan, M.M., and Tumlinson, J.H. (2003). Differential activity and degradation of plant volatile elicitors in regurgitant of tobacco hornworm (Manduca sexta) larvae. J. Chem. Ecol. 29 1357–1372. - PubMed
    1. Alborn, T., Turlings, T.C.J., Jones, T.H., Stenhagen, G., Loughrin, J.H., and Tumlinson, J.H. (1997). An elicitor of plant volatiles from beet armyworm oral secretion. Science 276 945–949.
    1. Allwood, E.G., Davies, D.R., Gerrish, C., Ellis, B.E., and Bolwell, G.P. (1999). Phosphorylation of phenylalanine ammonia-lyase: Evidence for a novel protein kinase and identification of the phosphorylated residue. FEBS Lett. 457 47–52. - PubMed

MeSH terms