. 2007 Mar;9(3):200-6.
doi: 10.1593/neo.07103.

Molecular characterization of TMPRSS2-ERG gene fusion in the NCI-H660 prostate cancer cell line: a new perspective for an old model

Affiliations

Molecular characterization of TMPRSS2-ERG gene fusion in the NCI-H660 prostate cancer cell line: a new perspective for an old model

Kirsten D Mertz et al. Neoplasia. 2007 Mar.

Abstract

Recent studies have established that a significant fraction of prostate cancers harbor a signature gene fusion between the 5' region of androgen-regulated TMPRSS2 and an ETS family transcription factor, most commonly ERG. Studies on the molecular mechanisms and functional consequences of this important chromosomal rearrangement are currently limited to the VCaP cell line derived from a vertebral bone metastasis of a hormone-refractory prostate tumor. Here we report on the NCI-H660 cell line, derived from a metastatic site of an extrapulmonary small cell carcinoma arising from the prostate. NCI-H660 harbors TMPRSS2-ERG fusion with a homozygous intronic deletion between TMPRSS2 and ERG. We demonstrate this by real-time quantitative polymerase chain reaction, a two-stage dual-color interphase fluorescence in situ hybridization (FISH) assay testing for TMPRSS2 and ERG break-aparts, and single-nucleotide polymorphism oligonucleotide arrays. The deletion is consistent with the common intronic deletion found on chromosome 21q22.2-3 in human prostate cancer samples. We demonstrate the physical juxtaposition of TMPRSS2 and ERG on the DNA level by fiber FISH. The androgen receptor-negative NCI-H660 cell line expresses ERG in an androgen-independent fashion. This in vitro model system has the potential to provide important pathobiologic insights into TMPRSS2-ERG fusion prostate cancer.


Figures

Figure 1
Figure 1
Characterization of TMPRSS2-ERG fusion and ERG expression in the NCI-H660 prostate cancer cell line. (A) RT-PCR using a forward primer in exon 1 of TMPRSS2 and a reverse primer in exon 6 of ERG revealed two transcripts of TMPRSS2-ERG fusion in NCI-H660 (first lane). For comparison, VCaP expressed only one fusion transcript (second lane), whereas normal PrSCs did not harbor TMPRSS2-ERG fusion (third lane). (B) The identity of the fusion transcripts was verified by sequencing. The shorter transcript consisted of TMPRSS2 exon 1 (T1) fused to ERG exon 4 (E4). This transcript was also found in the VCaP cell line. The longer transcript was identified as TMPRSS2 exons 1 and 2 (T1 and T2), fused to ERG exon 4 (E4). Upper panel: sequencing profiles of T1-E4 and T2-E4 transcripts. Lower panel: corresponding schemes of the two fusion types. (C) Real-time qPCR for TMPRSS2-ERG expression (upper panel) and ERG expression (lower panel) on several cancer cell lines. The standard (PrSCs) was expressed as 1 (dashed line). Orange bars correspond to TMPRSS2-ERG fusion through deletion in NCI-H660, leading to a ∼ 6 x 10³-fold overexpression of ERG. Green bars correspond to TMPRSS2-ERG fusion in VCaP, leading to a ∼ 5 x 10⁴-fold overexpression of ERG. Grey bars correspond to the other prostate cancer cell lines tested (PC3, LNCaP, DU145, and 22Rv1) that do not harbor TMPRSS2-ERG fusion and show baseline or moderately elevated ERG expression. Meg01 is a leukemia cell line without TMPRSS2-ERG fusion, but with overexpression of ERG (∼ 3 x 10³-fold), which served as a positive control for ERG expression.
Figure 2
Figure 2
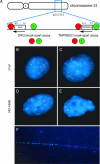
Dual-color TMPRSS2 and ERG break-apart FISH assays for the detection of TMPRSS2-ERG fusion in NCI-H660 and VCaP. (A) The scheme of the dual-color TMPRSS2 and ERG break-apart FISH assays explains the detection of TMPRSS2-ERG fusion. The location of the genes is indicated relative to the chromosome (boxes); the orientation of the genes is indicated by arrows. C = centromere; E = exon. For both assays, the relative location of differentially labeled telomeric and centromeric BAC probes is indicated by colored circles, with the color indicating the probe color in (B), (C), (D), and (E), and with the number identifying the BACs as follows: 1 = RP11-24A11; 2 = RP11-372O17; 3 = RP11-662D5; 4 = RP11-260O11. (B) FISH image of a VCaP interphase nucleus assessed by dual-color ERG break-apart assay (as illustrated in A). The nucleus contains several juxtaposed red and green signals for amplified wild-type alleles, and separated red and green signals indicating ERG insertion. (C) FISH image of a VCaP interphase nucleus assessed by dual-color TMPRSS2 break-apart assay (as illustrated in A). The nucleus contains several juxtaposed red and green signals for amplified wild-type alleles, and separated red and green signals indicating TMPRSS2 insertion. (D) FISH image of an NCI-H660 interphase nucleus assessed by dual-color ERG break-apart assay (as illustrated in A). The nucleus shows only two single red centromeric signals but no telomeric green signals. This is indicative of a fusion of TMPRSS2 with ERG through homozygous deletion of the intergenic region. (E) FISH image of an NCI-H660 interphase nucleus assessed by dual-color TMPRSS2 break-apart assay (as illustrated in A). The nucleus contains a juxtaposed red and green signal for the wild-type allele, and a single green signal indicating the deletion of one centromeric red probe. This is indicative of the fusion of TMPRSS2 with ERG through deletion of the intergenic region. (F) High-resolution FISH on chromatin fibers of NCI-H660 assessed by a TMPRSS2-specific probe (RP11-121A5; red) and an ERG-specific probe (RP11-476D17; green) (as illustrated in Figure W1).
Figure 3
Figure 3
Genomic loss between TMPRSS2 and ERG on chromosome 21q22.2-3 in prostate cancer cell lines, xenografts, and metastatic prostate cancer samples. 8K SNP data on a panel of 25 prostate cancer samples revealed genomic deletion between TMPRSS2 and ERG (21q22.2-3) in a subset of samples. (A) Twenty-five prostate cancer samples, including 7 cell lines, 11 xenografts, and 7 prostate cancer metastases, were analyzed for their TMPRSS2-ERG fusion status by qPCR and/or FISH and color-coded as described before [3] (blue, fusion-negative; green, fusion-positive through translocation; orange, fusion-positive through deletion). The plots on the right side of the panel represent the copy number ratio of the NCI-H660 and VCaP cell lines (vertical red lines represent baseline; no copy number variation). It is evident that VCaP shows copy number gain throughout the whole q arm of chromosome 21. (B) Magnification of the black framed box in (A), and status of the AR on chromosome X in these 25 samples. The blue signal in NCI-H660 corresponds to genomic copy number loss between TMPRSS2 and ERG. The strong intensity of this signal is consistent with homozygous loss, as demonstrated by FISH. The boundaries of the intronic deletion of NCI-H660 are very similar to the deletions seen in xenografts and tissue samples. Toward the telomeric side of the deletion in NCI-H660, the signal intensity is weaker, confirming different lengths of the deletions seen by FISH. The androgen-independent NCI-H660 cell line shows a loss in the region of the AR, whereas VCaP, which is known to be androgen-responsive, shows genomic gain in this area.
Figure 4
Figure 4
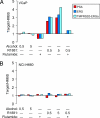
The androgen stimulation of the VCaP and NCI-H660 prostate cancer cell lines carrying TMPRSS2-ERG fusion. PSA (red bars), ERG (exons 5 and 6; dark blue bars), and TMPRSS-ERG (TMPRSS2 exon 1 to ERG exon 4; light blue bars) expression relative to HMBS in androgen-sensitive VCaP cells (A) and androgen-insensitive NCI-H660 cells (B) was assessed by qPCR. Cell lines were incubated with vehicle or 10 µM of the AR antagonist flutamide for 2 hours before treatment for 24 hours with 0.5 or 5 nM of the synthetic androgen R1881 or vehicle, as indicated. Relative amounts of PSA, ERG, or TMPRSS2-ERG per HMBS were compared for VCaP and NCI-H660.

Similar articles

Cited by

  • Detection of TMPRSS2-ERG fusion gene in benign prostatic hyperplasia.
    Velaeti S, Dimitriadis E, Kontogianni-Katsarou K, Savvani A, Sdrolia E, Pantazi G, Stefanakis S, Trangas T, Pandis N, Petraki K. Velaeti S, et al. Tumour Biol. 2014 Oct;35(10):9597-602. doi: 10.1007/s13277-014-2250-0. Epub 2014 Jun 25. Tumour Biol. 2014. PMID: 24961351
  • Increased nuclear factor I/B expression in prostate cancer correlates with AR expression.
    Nanda JS, Awadallah WN, Kohrt SE, Popovics P, Cates JMM, Mirosevich J, Clark PE, Giannico GA, Grabowska MM. Nanda JS, et al. Prostate. 2020 Sep;80(13):1058-1070. doi: 10.1002/pros.24019. Epub 2020 Jul 21. Prostate. 2020. PMID: 32692871 Free PMC article.
  • ERG gene rearrangements are common in prostatic small cell carcinomas.
    Lotan TL, Gupta NS, Wang W, Toubaji A, Haffner MC, Chaux A, Hicks JL, Meeker AK, Bieberich CJ, De Marzo AM, Epstein JI, Netto GJ. Lotan TL, et al. Mod Pathol. 2011 Jun;24(6):820-8. doi: 10.1038/modpathol.2011.7. Epub 2011 Feb 18. Mod Pathol. 2011. PMID: 21336263 Free PMC article.
  • Golgi protein GOLM1 is a tissue and urine biomarker of prostate cancer.
    Varambally S, Laxman B, Mehra R, Cao Q, Dhanasekaran SM, Tomlins SA, Granger J, Vellaichamy A, Sreekumar A, Yu J, Gu W, Shen R, Ghosh D, Wright LM, Kladney RD, Kuefer R, Rubin MA, Fimmel CJ, Chinnaiyan AM. Varambally S, et al. Neoplasia. 2008 Nov;10(11):1285-94. doi: 10.1593/neo.08922. Neoplasia. 2008. PMID: 18953438 Free PMC article.
  • Organoid cultures derived from patients with advanced prostate cancer.
    Gao D, Vela I, Sboner A, Iaquinta PJ, Karthaus WR, Gopalan A, Dowling C, Wanjala JN, Undvall EA, Arora VK, Wongvipat J, Kossai M, Ramazanoglu S, Barboza LP, Di W, Cao Z, Zhang QF, Sirota I, Ran L, MacDonald TY, Beltran H, Mosquera JM, Touijer KA, Scardino PT, Laudone VP, Curtis KR, Rathkopf DE, Morris MJ, Danila DC, Slovin SF, Solomon SB, Eastham JA, Chi P, Carver B, Rubin MA, Scher HI, Clevers H, Sawyers CL, Chen Y. Gao D, et al. Cell. 2014 Sep 25;159(1):176-187. doi: 10.1016/j.cell.2014.08.016. Epub 2014 Sep 4. Cell. 2014. PMID: 25201530 Free PMC article.

References

    1. Tomlins SA, Rhodes DR, Perner S, Dhanasekaran SM, Mehra R, Sun XW, Varambally S, Cao X, Tchinda J, Kuefer R, et al. Recurrent fusion of TMPRSS2 and ETS transcription factor genes in prostate cancer. Science. 2005;310:644–648. - PubMed
    1. Tomlins SA, Mehra R, Rhodes DR, Smith LR, Roulston D, Helgeson BE, Cao X, Wei JT, Rubin MA, Shah RB, et al. TMPRSS2:ETV4 gene fusions define a third molecular subtype of prostate cancer. Cancer Res. 2006;66:3396–3400. - PubMed
    1. Perner S, Demichelis F, Beroukhim R, Schmidt FH, Mosquera JM, Setlur S, Tchinda J, Tomlins SA, Hofer MD, Pienta KG, et al. TMPRSS2:ERG fusion-associated deletions provide insight into the heterogeneity of prostate cancer. Cancer Res. 2006;66:8337–8341. - PubMed
    1. Demichelis F, Fall K, Perner S, Andren O, Schmidt F, Setlur SR, Hoshida Y, Mosquera J-M, Pawitan Y, Lee C, et al. TMPRSS2:ERG gene fusion associated with lethal prostate cancer. Oncogene. 2007 2007 Jan 22 [Epub ahead of print] - PubMed
    1. Korenchuk S, Lehr JE, MClean L, Lee YG, Whitney S, Vessella R, Lin DL, Pienta KJ. VCaP, a cell-based model system of human prostate cancer. In Vivo. 2001;15:163–168. - PubMed

Publication types