

Anticoagulation control in the peri-hospitalization period
- PMID: 17401605
- PMCID: PMC2219864
- DOI: 10.1007/s11606-006-0064-5
Anticoagulation control in the peri-hospitalization period
Abstract
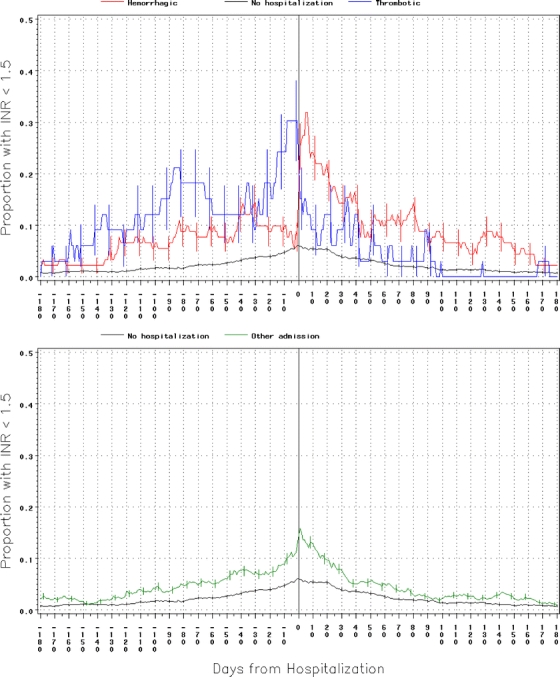
Oral anticoagulants (OAC) are effective and safe if the international normalized ratio (INR) is maintained within a narrow therapeutic range. Hospitalization is independently associated with poor anticoagulation control. The objective of this study is to describe how anticoagulation control changes in the peri-hospitalization period. This study is a retrospective cohort study using population-based administrative databases. INR results were retrieved from a population-based laboratory database. INR levels between laboratory measures were estimated using linear interpolation. Auto-regressive, integrated, moving average (ARIMA) time-series modeling was used to determine how anticoagulation control changed in the peri-hospitalization period. The study included 5,380 elderly patients in Eastern Ontario between 1 September 1999 and 1 September 2000 taking OACs. Results showed that 951 (17.7%) were hospitalized during their OAC therapy [thrombotic, n = 52 (1.0%); hemorrhagic, n = 140 (2.6%); other hospitalization types, n = 759 (14.1%)]. All measures of anticoagulation control changed significantly in the peri-hospitalization period. Before hemorrhagic admissions, mean INR and proportion with INR > 5 increased significantly (daily increase 0.024, P = .03 and 0.2%, P = .01). Following other hospitalization types, the proportion of patients with INR < 1.5 was significantly increased (daily increase 0.19%, P = .02). Patients admitted to the hospital for a variety of indications have significantly worse anticoagulation control in the peri-hospitalization period. Anticoagulated patients discharged after medical hospitalizations could be targeted for improved anticoagulation control.
Figures


Similar articles
-
The effect of hospitalization on oral anticoagulation control: a population-based study.Thromb Res. 2007;119(6):705-14. doi: 10.1016/j.thromres.2006.05.017. Epub 2006 Jul 17. Thromb Res. 2007. PMID: 16844204
-
Burden of potentially avoidable anticoagulant-associated hemorrhagic and thromboembolic events in the elderly.Chest. 2007 May;131(5):1508-15. doi: 10.1378/chest.06-2628. Epub 2007 Feb 22. Chest. 2007. PMID: 17317732
-
Point-of-Care International Normalized Ratio (INR) Monitoring Devices for Patients on Long-term Oral Anticoagulation Therapy: An Evidence-Based Analysis.Ont Health Technol Assess Ser. 2009;9(12):1-114. Epub 2009 Sep 1. Ont Health Technol Assess Ser. 2009. PMID: 23074516 Free PMC article.
-
Cognitive impairment as determinant for sub-optimal control of oral anticoagulation treatment in elderly patients with atrial fibrillation.Drugs Aging. 2005;22(4):353-60. doi: 10.2165/00002512-200522040-00007. Drugs Aging. 2005. PMID: 15839723 Review.
-
Frequency of adverse events in patients with poor anticoagulation: a meta-analysis.CMAJ. 2007 May 22;176(11):1589-94. doi: 10.1503/cmaj.061523. CMAJ. 2007. PMID: 17515585 Free PMC article. Review.
Cited by
-
Discontinuation of anticoagulant care during admission to a psychiatric hospital.Eur J Clin Pharmacol. 2013 Apr;69(4):1025-9. doi: 10.1007/s00228-012-1398-z. Epub 2012 Oct 23. Eur J Clin Pharmacol. 2013. PMID: 23090698
-
Differences of Disabling Symptoms between Previously Hospitalized or Non-Hospitalized Currently Working Long-COVID Survivors One Year after Infection: A Descriptive Study.Healthcare (Basel). 2023 Aug 16;11(16):2306. doi: 10.3390/healthcare11162306. Healthcare (Basel). 2023. PMID: 37628505 Free PMC article.
-
Preventing the preventable: reducing rehospitalizations through coordinated, patient-centered discharge processes.Prof Case Manag. 2009 May-Jun;14(3):135-40; quiz 141-2. doi: 10.1097/NCM.0b013e318198d4e1. Prof Case Manag. 2009. PMID: 19474639 Free PMC article.
-
Risk of overanticoagulation during acute kidney injury in patients treated with vitamin K antagonists.Nephrol Dial Transplant. 2022 Mar 25;37(4):681-686. doi: 10.1093/ndt/gfab008. Nephrol Dial Transplant. 2022. PMID: 33459792 Free PMC article.
References
-
- van Walraven C, Austin PC, Oake N, Wells PS, Mamdani M, Forster AJ. The influence of hospitalization on oral anticoagulation control: a population-based study. Thromb Res. 2006. (In press) - PubMed
-
- {'text': '', 'ref_index': 1, 'ids': [{'type': 'DOI', 'value': '10.1067/mva.2001.111986', 'is_inner': False, 'url': 'https://doi.org/10.1067/mva.2001.111986'}, {'type': 'PubMed', 'value': '11241122', 'is_inner': True, 'url': 'https://pubmed.ncbi.nlm.nih.gov/11241122/'}]}
- Tangelder MJD, Algra A, Lawson JA, Hennekes S, Eikelboom BC. Optimal oral anticoagulant intensity to prevent secondary ischemic and hemorrhagic events in patients after infrainguinal bypass graft surgery. J Vasc Surg. 2001;33(3):522–27. - PubMed
-
- {'text': '', 'ref_index': 1, 'ids': [{'type': 'DOI', 'value': '10.1056/NEJM199507063330103', 'is_inner': False, 'url': 'https://doi.org/10.1056/nejm199507063330103'}, {'type': 'PubMed', 'value': '7776988', 'is_inner': True, 'url': 'https://pubmed.ncbi.nlm.nih.gov/7776988/'}]}
- Cannegieter SC, Rosendaal FR, Wintzen AR, van der Meer FJ, Vandenbroucke JP, Briet E. Optimal oral anticoagulant therapy in patients with mechanical heart valves. N Engl J Med. 1995;333(1):11–7. - PubMed
-
- {'text': '', 'ref_index': 1, 'ids': [{'type': 'DOI', 'value': '10.1111/j.1365-2141.2004.05348.x', 'is_inner': False, 'url': 'https://doi.org/10.1111/j.1365-2141.2004.05348.x'}, {'type': 'PubMed', 'value': '15686461', 'is_inner': True, 'url': 'https://pubmed.ncbi.nlm.nih.gov/15686461/'}]}
- Veeger NJ, Piersma-Wichers M, Tijssen JG, Hillege HL, van der MJ, Veeger NJGM et al. Individual time within target range in patients treated with vitamin K antagonists: main determinant of quality of anticoagulation and predictor of clinical outcome. A retrospective study of 2300 consecutive patients with venous thromboembolism. Br J Haematol. 2005;128(4):513–19. - PubMed
-
- {'text': '', 'ref_index': 1, 'ids': [{'type': 'PubMed', 'value': '9423791', 'is_inner': True, 'url': 'https://pubmed.ncbi.nlm.nih.gov/9423791/'}]}
- Palareti G, Manotti C, D’Angelo A, Pengo V, Erba N, Moia M et al. Thrombotic events during oral anticoagulant treatment: results of the inception-cohort, prospective, collaborative ISCOAT study: ISCOAT study group (Italian Study on Complications of Oral Anticoagulant Therapy). Thromb Haemost. 1997;78(6):1438–43. - PubMed
Publication types
MeSH terms
Substances
LinkOut - more resources
Full Text Sources
Medical
