. 2007 Apr;5(4):253-64.
doi: 10.1016/j.cmet.2007.02.008.

Mitochondrial GTP regulates glucose-stimulated insulin secretion

Affiliations

Mitochondrial GTP regulates glucose-stimulated insulin secretion

Richard G Kibbey et al. Cell Metab. 2007 Apr.

Abstract

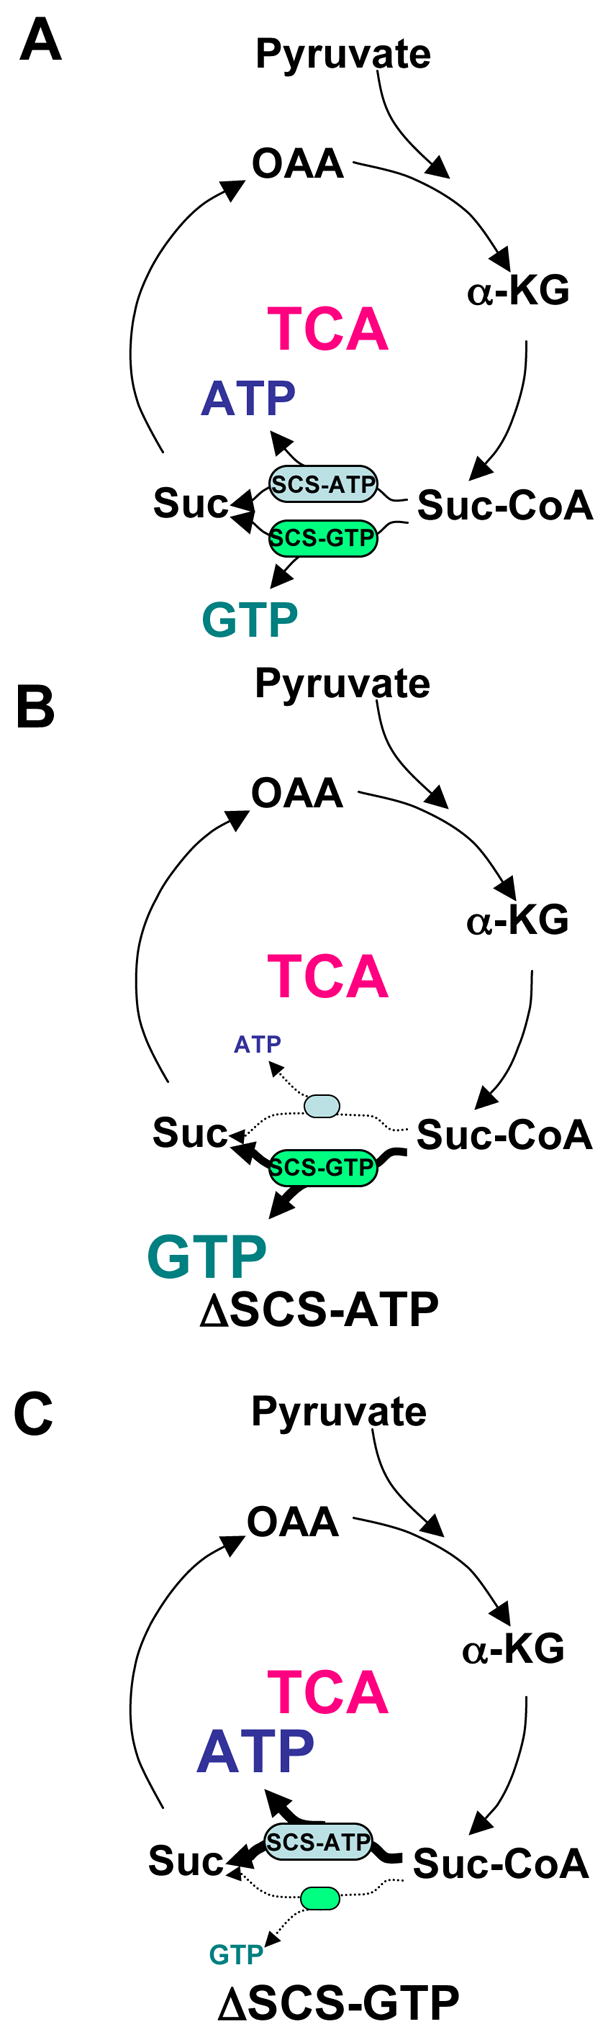
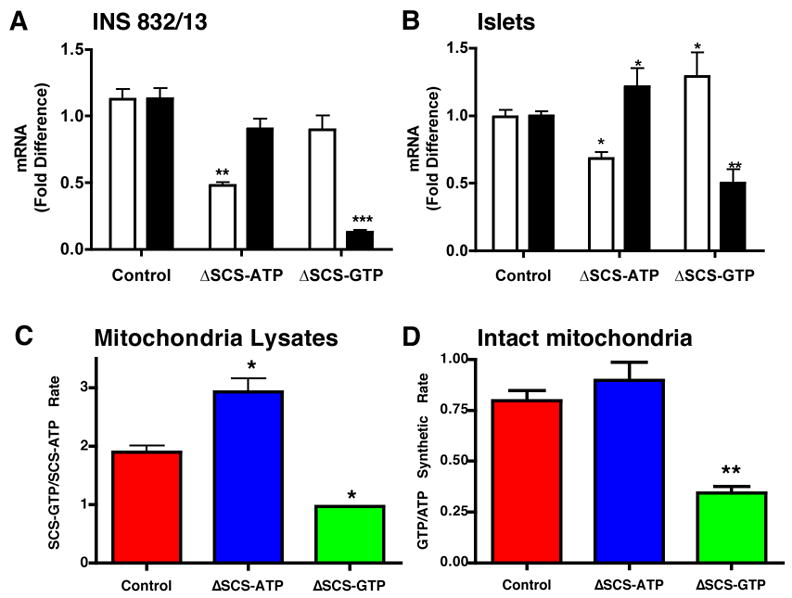
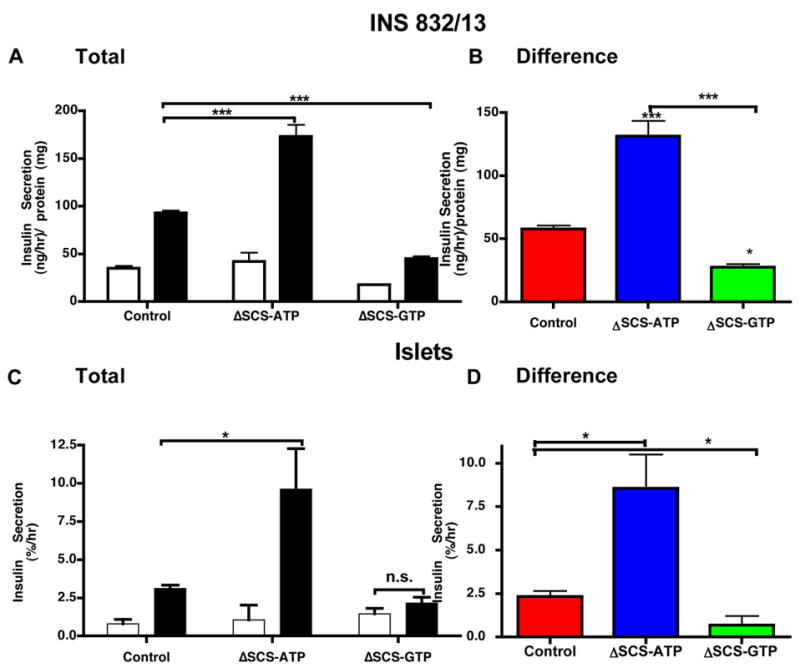
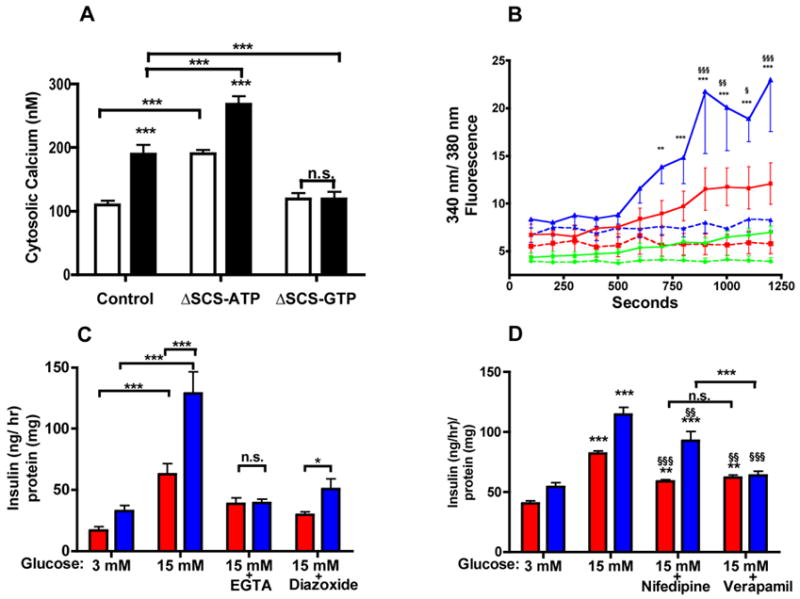
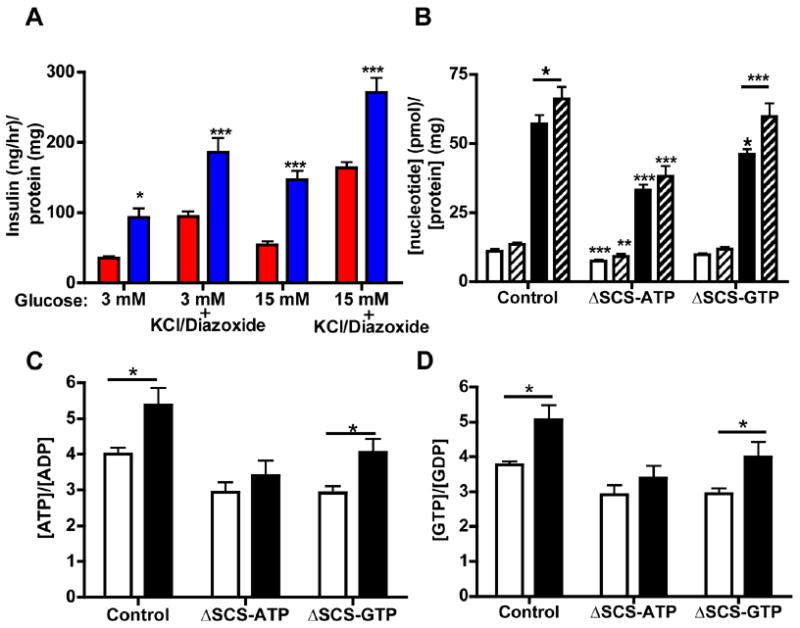
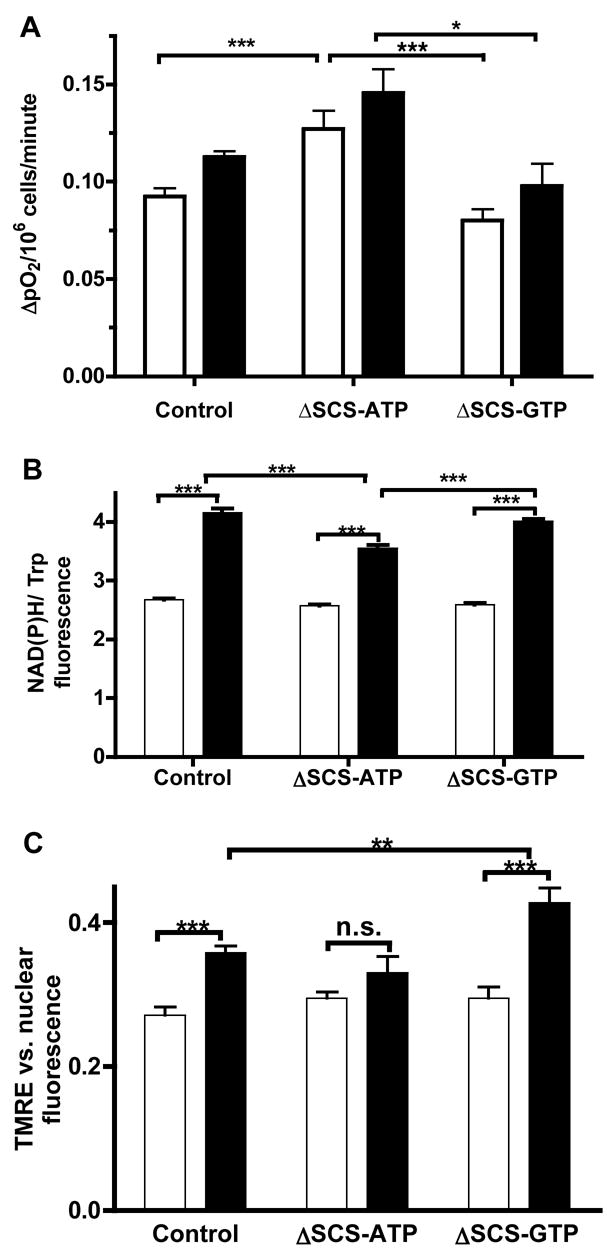
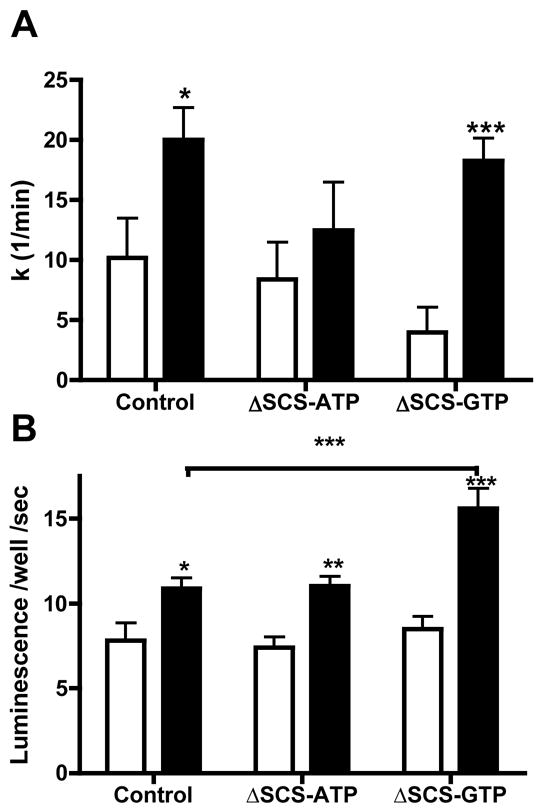
Nucleotide-specific isoforms of the tricarboxylic acid (TCA) cycle enzyme succinyl-CoA synthetase (SCS) catalyze substrate-level synthesis of mitochondrial GTP (mtGTP) and ATP (mtATP). While mtATP yield from glucose metabolism is coupled with oxidative phosphorylation and can vary, each molecule of glucose metabolized within pancreatic beta cells produces approximately one mtGTP, making mtGTP a potentially important fuel signal. In INS-1 832/13 cells and cultured rat islets, siRNA suppression of the GTP-producing pathway (DeltaSCS-GTP) reduced glucose-stimulated insulin secretion (GSIS) by 50%, while suppression of the ATP-producing isoform (DeltaSCS-ATP) increased GSIS 2-fold. Insulin secretion correlated with increases in cytosolic calcium, but not with changes in NAD(P)H or the ATP/ADP ratio. These data suggest a role for mtGTP in controlling pancreatic GSIS through modulation of mitochondrial metabolism, possibly involving mitochondrial calcium. Furthermore, in light of its tight coupling to TCA oxidation rates, mtGTP production may serve as an important molecular signal of TCA-cycle activity.


Figures

Figure 1
Figure 1. Schematic of mtGTP production
A) Pyruvate from glycolysis supplies carbon to the TCA cycle that is subsequently metabolized to succinyl-CoA. Succinyl-CoA is enzymatically converted to succinate and either ATP by SCS-ATP or GTP by SCS-GTP. B) SCS-ATP silencing (ΔSCS-ATP) leads to diversion of TCA flux through SCS-GTP to increase mtGTP. C) SCS-GTP silencing (ΔSCS-GTP) reduces flux through SCS-GTP resulting in lower mtGTP production.
Figure 2
Figure 2. Silencing of SCS-ATP and SCS-GTP in INS 832/13 cells and rat islets
A and B) Fold change in SCS-ATP (white) and SCS-GTP (black) in INS 832/13 cells (n=4) (A) and rat islets (n=5) (B) 48 hours following transfection with siRNA against SCS-ATP or SCS-GTP. C and D ) Ratio of SCS-GTP to SCS-ATP enzyme activities in mitochondrial extracts (C) and intact mitochondria treated with 10 μg/ml oligomycin and 100 μM DNP (D) isolated from control (red), ΔSCS-ATP (blue), and ΔSCS-GTP (green) cells (n=3). Error bars show mean ± SEM; ANOVA: *, p<0.05; **, p<0.01; *** p<0.001 vs. control.
Figure 3
Figure 3. Stimulated insulin secretion in SCS isoform silenced INS cells and rat islets
Static insulin secretion assays were performed in (A and B) INS 832/13 cells (n=8) or (C and D) rat islets (n=6 with ~11 islets/replicate) for 90 minutes following siRNA transfection in 3 mM (white) and 15 mM (black) glucose. (B and D) show the difference in insulin secretion between basal and stimulation for each group. Error bars show mean ± SEM; ANOVA: *, p<0.05; **, p<0.01; ***, p<0.001 compared to controls. For all groups basal vs. stimulated insulin secretion was statistically significant (t-test) unless otherwise shown (n.s. = not significant).
Figure 4
Figure 4. mtGTP-mediated insulin secretion is cytosolic calcium-dependent
A) Cytosolic calcium concentration determined by fura-2 AM labeling of control, ΔSCS-ATP, and ΔSCS-GTP INS cells following 30 minutes of stimulation with 3 mM (white) or 15 mM (black) glucose (n=10). B) The ratio of 340 nm/380 nm fluorescence over time of control (red square), ΔSCS-ATP (blue triangle), and ΔSCS-GTP (green circle) cells loaded with fura-2 AM and stimulated with either 3 mM (broken) or 15 mM (solid) glucose (n=8). C, D) Insulin secretion in control (red) and ΔSCS-ATP (blue) cells in basal or stimulatory media (C) plus 250 μM diazoxide or 3 mM EGTA for 45 minutes (n=6) or (D) plus 20 uM nifedipine or 100 μM verapamil for 2 hours (n=6). Error bars show mean ± SEM; 2-way ANOVA **, p<0.01; *** p<0.001 vs. control unless otherwise indicated. §, P<0.05; §§, p<0.01; §§§ p<0.001 vs. stimulated.
Figure 5
Figure 5. mtGTP is a non-canonical signal for GSIS
A) Insulin secretion following stimulation for 45 minutes with 15 mM glucose ± 30 mM KCl and 250 μM Diazoxide (n=6) for control (red) and ΔSCS-ATP (blue) cells (n=6). Significance is shown vs. controls. B) Whole-cell concentration of GTP (white) and ATP (black) from control, ΔSCS-ATP, and ΔSCS-GTP cells in 3 mM (open) and 15 mM (hatched) glucose. Significance is vs. controls unless otherwise indicated (n=12). C and D) Ratios of C) ATP/ADP and D) GTP/GDP ratio from control, ΔSCS-ATP, and ΔSCS-GTP cells in 3 mM (white) and 15 mM (black) glucose. Significance is shown vs. the basal state (n=12). Error bars show mean ± SEM; 2-way ANOVA or t-test between basal and stimulation: *, p<0.05; **, p<0.01; *** p<0.001 vs. control unless otherwise stated.
Figure 6
Figure 6. mtGTP effects on oxygen consumption, NADPH oxidation, and ΔΨ
A) Oxygen consumption rates of suspended cells at 3 mM (white) and 15 mM (black) glucose following silencing of SCS (n=14 basal and n=5 stimulation). B) Cellular NAD(P)H in response to 3 mM (white) and 15mM (black) glucose as measured by the ratio of NAD(P)H to tryptophan autofluorescence in suspended cells (n=4). C) Mitochondrial membrane potential in response to 3 mM (white) and 15 mM (black) glucose as measured by the ratio of fluorescence of TMRE (ΔΨ) vs. Hoescht 33342 (nuclear) (n=14). Error bars show mean ± SEM; ANOVA: *, p<0.05; **, p<0.01; *** p<0.001 compared to controls unless otherwise indicated.
Figure 7
Figure 7. mtGTP alters the balance between ATP synthesis and mitochondrial calcium export
A) In vivo ATP synthesis rates in entrapped and perfused control, ΔSCS-ATP, and ΔSCS-GTP cells in 3 mM (white) and 15 mM (black) glucose as determined by saturation transfer of ATP gamma 31P. Significance is shown vs. the basal state (n=6). B) Mitochondrial calcium concentration determined by aequorin luminescence in INS EK-3 cells in control, ΔSCS-ATP, and ΔSCS-GTP cells following 15 minutes of stimulation with 3 mM (white) or 15 mM (black) glucose. Error bars show mean ± SEM; ANOVA:*, p<0.05; **, p<0.01; *** p<0.001 compared to controls unless otherwise indicated.

References

    1. Antinozzi PA, Ishihara H, Newgard CB, Wollheim CB. Mitochondrial metabolism sets the maximal limit of fuel-stimulated insulin secretion in a model pancreatic beta cell: a survey of four fuel secretagogues. Journal of Biological Chemistry. 2002;277:11746–11755. - PubMed
    1. Arkhammar P, Nilsson T, Berggren PO. Glucose-stimulated efflux of fura-2 in pancreatic beta-cells is prevented by probenecid. Biochem Biophys Res Commun. 1989;159:223–228. - PubMed
    1. Bokvist K, Ammala C, Ashcroft FM, Berggren PO, Larsson O, Rorsman P. Separate processes mediate nucleotide-induced inhibition and stimulation of the ATP-regulated K(+)-channels in mouse pancreatic beta-cells. Proc Biol Sci. 1991;243:139–144. - PubMed
    1. Brdiczka DG, Zorov DB, Sheu SS. Mitochondrial contact sites: their role in energy metabolism and apoptosis. Biochim Biophys Acta. 2006;1762:148–163. - PubMed
    1. Cline GW, LePine RL, Papas KK, Kibbey RG, Shulman GI. 13C NMR Isotopomer Analysis of Anaplerotic Pathways in INS-1 Cells. Journal of Biological Chemistry. 2004;279:44370–44375. - PubMed

Publication types

MeSH terms