. 2007 Apr;5(4):279-91.
doi: 10.1016/j.cmet.2007.02.002.

Glycosylphosphatidylinositol-anchored high-density lipoprotein-binding protein 1 plays a critical role in the lipolytic processing of chylomicrons

Affiliations

Glycosylphosphatidylinositol-anchored high-density lipoprotein-binding protein 1 plays a critical role in the lipolytic processing of chylomicrons

Anne P Beigneux et al. Cell Metab. 2007 Apr.

Abstract

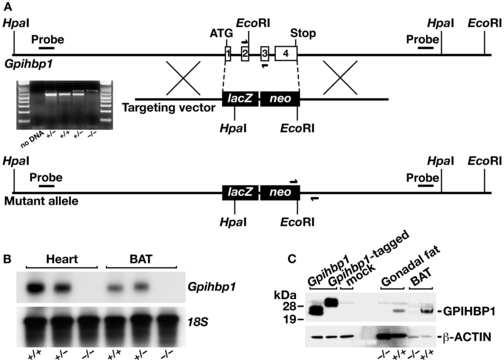
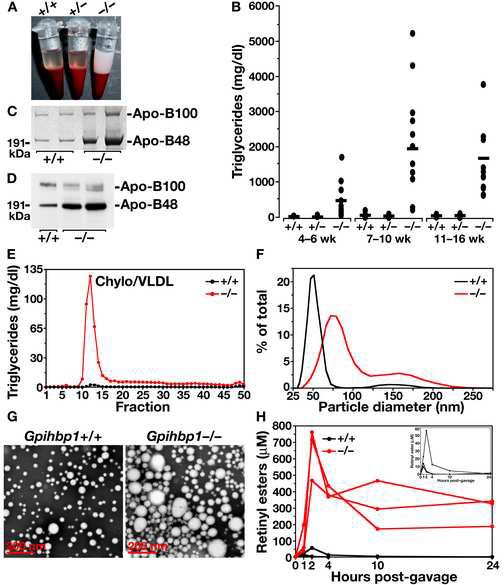
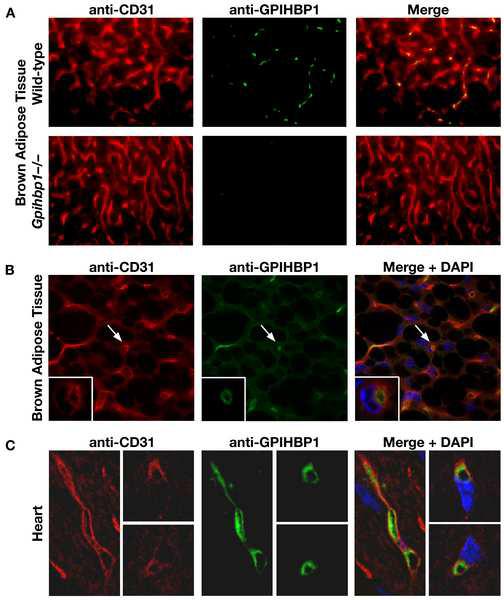
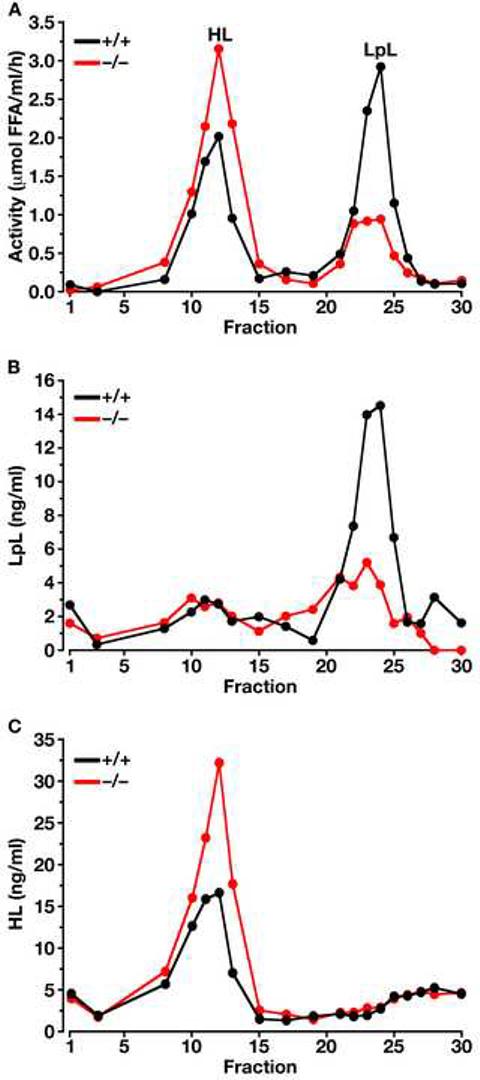
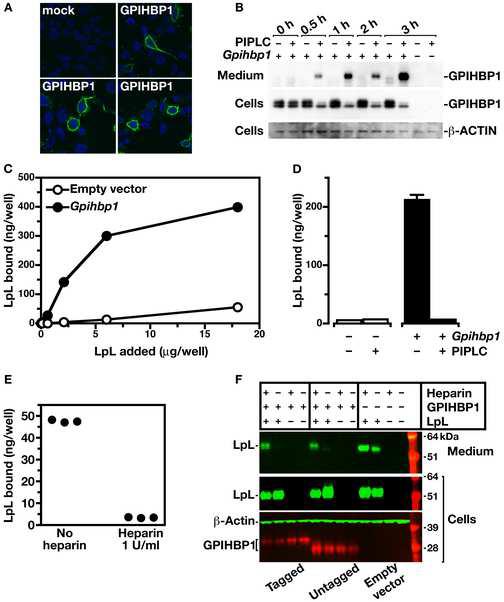
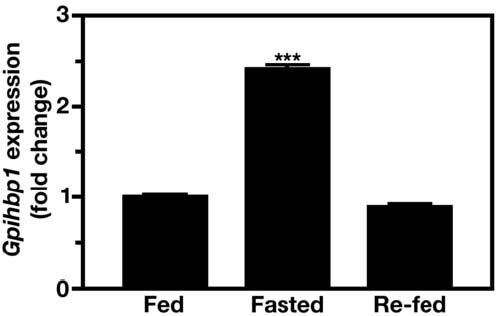
The triglycerides in chylomicrons are hydrolyzed by lipoprotein lipase (LpL) along the luminal surface of the capillaries. However, the endothelial cell molecule that facilitates chylomicron processing by LpL has not yet been defined. Here, we show that glycosylphosphatidylinositol-anchored high-density lipoprotein-binding protein 1 (GPIHBP1) plays a critical role in the lipolytic processing of chylomicrons. Gpihbp1-deficient mice exhibit a striking accumulation of chylomicrons in the plasma, even on a low-fat diet, resulting in milky plasma and plasma triglyceride levels as high as 5000 mg/dl. Normally, Gpihbp1 is expressed highly in heart and adipose tissue, the same tissues that express high levels of LpL. In these tissues, GPIHBP1 is located on the luminal face of the capillary endothelium. Expression of GPIHBP1 in cultured cells confers the ability to bind both LpL and chylomicrons. These studies strongly suggest that GPIHBP1 is an important platform for the LpL-mediated processing of chylomicrons in capillaries.


Figures

Figure 1
Figure 1
Generation of Gpihbp1 knockout mice. (A) Sequence-replacement gene-targeting strategy for inactivating Gpihbp1. Locations of the 5′ and 3′ probes (bars) for Southern blot analysis and PCR primers (arrows) for genotyping are shown. An ethidium-bromide stained agarose gel illustrates a PCR strategy for genotyping Gpihbp1+/+, Gpihbp1+/−, and Gpihbp1−/− mice. A description of the PCR genotyping strategy is contained in the Experimental Procedures. (B) A northern blot, probed with a Gpihbp1 cDNA probe spanning the complete open reading frame of Gpihbp1, shows the absence of Gpihbp1 expression in heart and brown adipose tissue (BAT) from Gpihbp1−/− mice. (C) Western blot with a GPIHBP1-specific rabbit antiserum showing GPIHBP1 in brown adipose tissue (BAT) and gonadal fat pad extracts from Gpihbp1+/+ mice but not Gpihbp1−/− mice. As a control, extracts from HeLa cells that had been transfected with an untagged or an S-protein–tagged GPIHBP1 construct were included.
Figure 2
Figure 2
Analysis of Gpihbp1 knockout mice. (A) Photograph of blood samples from three two-month-old littermate chow-fed male mice (after low-speed centrifugation to sediment blood cells), revealing “milky” plasma in Gpihbp1−/− mice. (B) Plasma triglyceride levels in Gpihbp1+/+, Gpihbp1+/−, and Gpihbp1−/− mice at different ages, showing higher triglyceride levels in Gpihbp1−/− mice (P < 0.0001 in each age group). Triglyceride levels in Gpihbp1+/+ and Gpihbp1+/− mice were not different. (C) Coomassie blue–stained SDS-polyacrylamide gel of the d < 1.006 g/ml lipoproteins of wild-type and Gpihbp1−/− mice. (D) Western blot of mouse plasma (1.0 μl) with a mouse monoclonal antibody specific for apo-B48 and apo-B100 (Nguyen et al., 2006), showing increased amounts of apo-B48 in the plasma of Gpihbp1−/− mice. (E) Distribution of triglycerides in the plasma lipoproteins of Gpihbp1+/+ and Gpihbp1−/− mice. Plasma lipoproteins were separated by size on a Superose 6 FPLC column. Representative of two different experiments. (F) Distribution of lipoprotein sizes in the d < 1.022 g/ml lipoproteins from Gpihbp1−/− and Gpihbp1+/+ mice, as judged by dynamic laser light scattering methods. The median diameter of lipoproteins in Gpihbp1−/− mice (n = 3) was 157% larger than in Gpihbp1+/+ mice (n = 6). Shown here are representative data from a single Gpihbp1−/− and Gpihbp1+/+ mouse. Both Gpihbp1+/+ and Gpihbp1−/− mice had bimodal distributions of lipoproteins; the larger subpopulation of particles in Gpihbp1−/− mice, constituting 15.4% of the total particles, had diameters of 122–289 nm; in Gpihbp1+/+ mice, the larger population of particles, constituting 2.9% of particles, were 94–204 nm. The smaller subpopulation of particles in Gpihbp1−/− and Gpihbp1+/+ mice had diameters of 39–111 and 33–86 nm, respectively. (G) Electron micrographs of negatively stained d < 1.006 g/ml lipoproteins from the plasma of Gpihbp1−/− and Gpihbp1+/+ mice, showing the larger lipoproteins in Gpihbp1−/− mice. Representative images from two Gpihbp1−/− and two Gpihbp1+/+ samples. (H) Delayed clearance of retinyl esters in Gpihbp1−/− mice. Retinyl palmitate (5,000 IU in 50 μl of vegetable oil) was administered to mice by gavage, and retinyl esters in the plasma were measured over the next 24 h. The inset shows the retinyl ester levels in Gpihbp1+/+ mice plotted on a smaller scale, showing that the levels in Gpihbp1+/+ mice peaked between 1 and 3 h and had largely disappeared by 10 h. Retinyl palmitate clearance studies were also performed in Gpihbp1+/− mice, and they were indistinguishable from those of Gpihbp1+/+ mice. The retinyl palmitate clearance studies were performed in 7 Gpihbp1−/−, 6 Gpihbp1+/−, and 5 Gpihbp1+/+ mice. Shown here are representative curves for 3 Gpihbp1−/− and Gpihbp1+/+ mice. When the retinyl ester measurements for all of the mice were analyzed, the differences between the Gpihbp1−/− mice and the other two groups were statistically significant at each time point (P < 0.001). There were no differences between Gpihbp1+/− and Gpihbp1+/+ mice.
Figure 3
Figure 3
GPIHBP1 is located within the lumen of the capillary endothelium of brown adipose tissue and heart. (A) Epifluorescence microscopy showing the binding of a rat monoclonal antibody against mouse CD31 (red) and a rabbit antiserum against GPIHBP1 (green) to brown adipose tissue of Gpihbp1+/+ and Gpihbp1−/− mice. Images were taken with a 40× objective. (B) Confocal microscopy images showing the binding of antibodies against CD31 and GPIHBP1 to brown adipose tissue from a Gpihbp1+/+ mouse. Images were taken with a 100× objective. The arrow indicates the location of a capillary (shown at higher magnification in the insert; 100× objective with 4× digital zoom). The high-magnification micrograph shows a cross-section of a capillary, revealing that GPIHBP1 staining is particularly prominent on the luminal side of the capillary. (C) Confocal microscopy images showing the binding of antibodies against CD31 and GPIHBP1 to heart tissue from a Gpihbp1+/+ mouse. GPIHBP1 staining is particularly prominent on the luminal face of the capillary endothelium. Images were taken with a 100× objective.
Figure 4
Figure 4
Separation of LpL and HL in the post-heparin plasma of Gpihbp1−/− and wild-type mice on a heparin-Sepharose column. (A) Lipase activities in the different fractions (representative data of four independent experiments). In these studies, the identities of the LpL and HL peaks were verified with immunoassays (B and C, respectively) (Cisar et al., 1989). The specific activity of the LpL in fractions 21–25 of the wild-type and Gpihbp1−/− mouse plasma was not different. Each data point represents the average of duplicate analyses.
Figure 5
Figure 5
Generating cell lines expressing a Gpihbp1 cDNA and testing the ability of GPIHBP1 to bind LpL. In preliminary studies, we showed that the expression of Gpihbp1 was absent in wild-type CHO cells. (A) Confocal immunofluorescence microscopy showing the expression of an S-protein–tagged GPIHBP1 on the surface of CHO ldlA7 cells. GPIHBP1 was visualized with a FITC-conjugated goat antibody against the S-protein tag (green) and DNA was visualized with DAPI (blue). (B) Western blot analysis of cell extracts and cell culture medium from HeLa cells that had been transfected with a mouse Gpihbp1 cDNA, before and after treatment of the cells with PIPLC. (C) Binding of LpL to pgsA-745 CHO cells stably transfected with a cDNA encoding mouse Gpihbp1 (pcDNA3-Gpihbp1, see Experimental Procedures) or empty vector. Cells were incubated for 2 h with increasing amounts of avian LpL. Following the incubation, the amount of bound LpL was measured with an ELISA. Each data point represents the mean of triplicates (± S.D.). Standard deviations are too small to be seen. (D) Binding of avian LpL (2.5 μg/ml) to pgsA-745 CHO cells transfected with pcDNA3-Gpihbp1 or empty vector, before and after treatment with PIPLC. Each bar represents the mean (± S.D.) of triplicate determinations; in some cases, the standard deviations are too small to be seen. For several groups, the standard error bars are too small to be seen. In parallel experiments, pgsB-761 CHO cells transfected with the Gpihbp1 cDNA also bound 10-fold more LpL than cells transfected with the empty vector. In wild-type CHO cells, LpL binding to nontransfected cells was greater (as a result of the expected binding of LpL to HSPGs), but we consistently observed a 70% increase in LpL binding to Gpihbp1-transfected cells. (E) Binding of avian LpL (2.5 μg/ml) to pgsA-745 CHO cells transfected with pcDNA3-Gpihbp1 or empty vector, before and after treatment with heparin (1 U/ml). (F) Western blot analysis of cell extracts and cell culture medium from pgsA-745 CHO cells transfected with a mouse Gpihbp1 cDNA (tagged and untagged) or empty vector, alone or in combination with a human LPL cDNA (with a C-terminus V5 tag), before and after treatment of the cells with heparin (1 U/ml).
Figure 6
Figure 6
Binding of chylomicrons to CHO-ldlA7 cells expressing mouse GPIHBP1. (A) The binding of DiI-labeled chylomicrons (red) to nonpermeabilized CHO-ldlA7 cells that had been stably transfected with a mouse Gpihbp1 cDNA (or empty vector) was measured at 4°C, before and after PIPLC treatment. GPIHBP1 expression was detected with the rabbit anti-GPIHBP1 antiserum and a FITC-labeled anti-rabbit IgG antibody (green). DNA was visualized with a DAPI stain (blue). (B) Binding of DiI-labeled chylomicrons (red) to CHO-ldlA7 cells that had been transiently transfected with a mouse Gpihbp1 cDNA. GPIHBP1 expression was detected as described in Panel A.
Figure 7
Figure 7
Regulation of Gpihbp1 expression in quadriceps according to feeding status. RNA was isolated from fed mice, fasted mice (16 h), and fasted/re-fed mice (6 h post-refeeding a high-carbohydrate diet) (10-week-old wild-type C57BL/6 male mice; n = 10 per group), and the expression of Gpihbp1 measured by quantitative RT-PCR (mean ± S.D.). β-2 microglobulin expression was used to normalize the data. Values show the amount of Gpihbp1 mRNA relative to that in fed mice. ***, P < 0.001.

Comment in

References

    1. Beckstead JA, Oda MN, Martin DDO, Forte TM, Bielicki JK, Berger T, Luty R, Kay CM, Ryan RO. Structure-Function Studies of Human Apolipoprotein A-V: A Regulator of Plasma Lipid Homeostasis. Biochemistry. 2003;42:9416–9423. - PubMed
    1. Bengtsson G, Olivecrona T. Apolipoprotein CII enhances hydrolysis of monoglycerides by lipoprotein lipase, but the effect is abolished by fatty acids. FEBS Lett. 1979;106:345–348. - PubMed
    1. Bensadoun A, Hsu J, Hughes B. Large-scale lipoprotein lipase purification from adipose tissue. Methods Mol. Biol. 1999;109:145–150. - PubMed
    1. Blaner WS, Obunike JC, Kurlandsky SB, al-Haideri M, Piantedosi R, Deckelbaum RJ, Goldberg IJ. Lipoprotein lipase hydrolysis of retinyl ester. Possible implications for retinoid uptake by cells. J. Biol. Chem. 1994;269:16559–16565. - PubMed
    1. Breckenridge WC, Little JA, Steiner G, Chow A, Poapst M. Hypertriglyceridemia associated with deficiency of apolipoprotein C-II. N. Engl. J. Med. 1978;298:1265–1273. - PubMed

Publication types