. 2007 Apr 16;204(4):879-91.
doi: 10.1084/jem.20061699. Epub 2007 Apr 2.

Spontaneous tumor rejection by cbl-b-deficient CD8+ T cells

Affiliations

Spontaneous tumor rejection by cbl-b-deficient CD8+ T cells

Stefanie Loeser et al. J Exp Med. .

Abstract

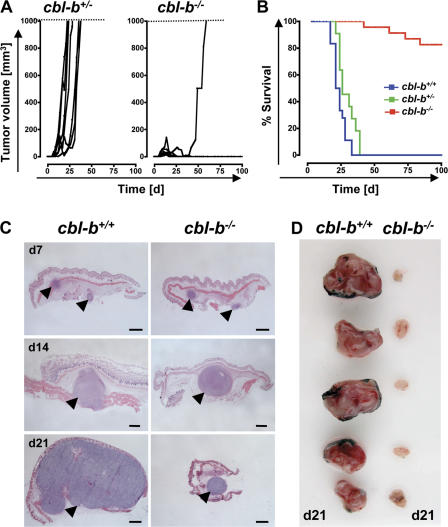
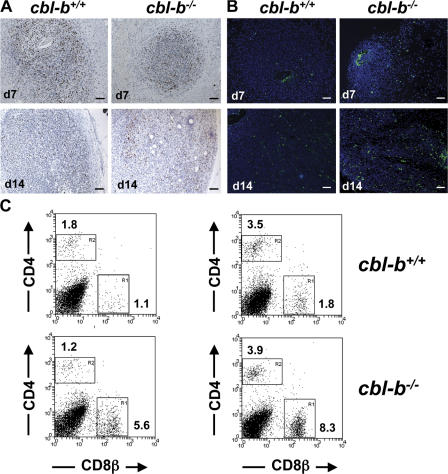
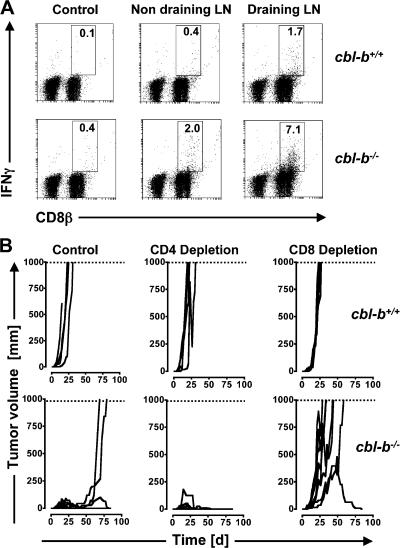
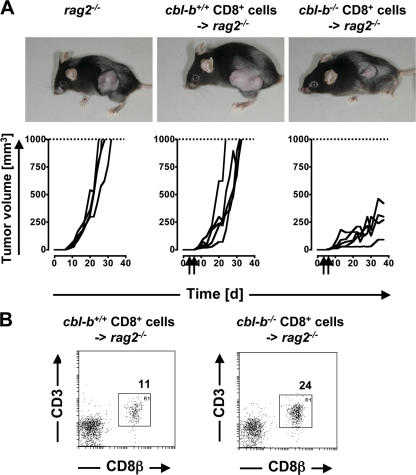
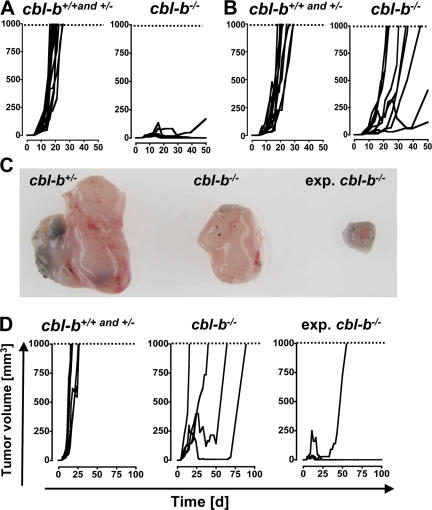
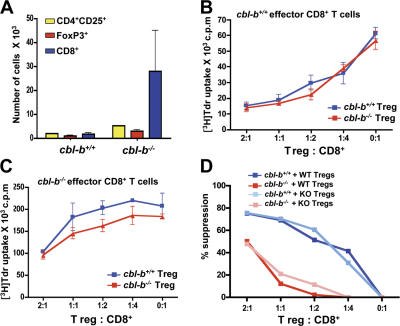
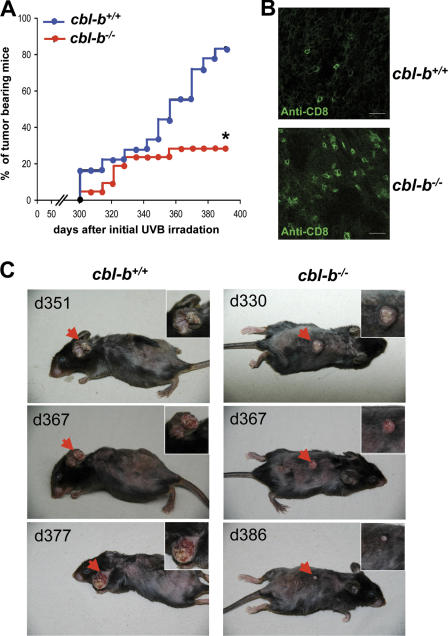
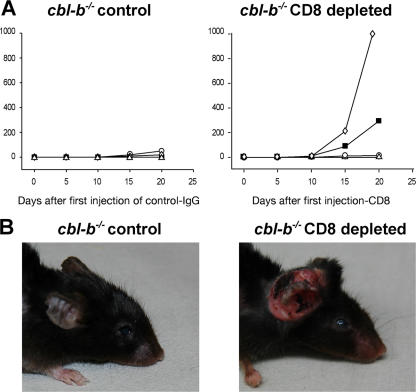
The concept of tumor surveillance implies that specific and nonspecific components of the immune system eliminate tumors in the early phase of malignancy. Understanding the biochemical mechanisms of tumor immunosurveillance is of paramount significance because it might allow one to specifically modulate spontaneous antitumor activity. We report that inactivation of the E3 ligase Casitas B cell lymphoma-b (Cbl-b) confers spontaneous in vivo rejection of tumor cells that express human papilloma virus antigens. Moreover, cbl-b(-/-) mice develop significantly fewer ultraviolet B (UVB)-induced skin malignancies and reject UVB-induced skin tumors. CD8(+) T cells were identified as key players in the spontaneous tumor rejection response. Loss of Cbl-b not only enhances antitumor reactivity of CD8(+) T cells but also occurs in the absence of CD4(+) T cells. Mechanistically, cbl-b(-/-) CD8(+) T cells are resistant to T regulatory cell-mediated suppression and exhibit enhanced activation and rapid tumor infiltration. Importantly, therapeutic transfer of naive cbl-b(-/-) CD8(+) T cells is sufficient to mediate rejection of established tumors. Even up to 1 yr after the first encounter with the tumor cells, cbl-b(-/-) mice carry an "anticancer memory." These data identify Cbl-b as a key signaling molecule that controls spontaneous antitumor activity of cytotoxic T cells in different cancer models. Inhibition of Cbl-b is a novel approach to stimulate long-lasting immunity against cancer.


Figures

Figure 1.
Figure 1.
Spontaneous tumor rejection in cbl-b−/− mice. (A) Kinetics of TC-1 tumor cell growth in cbl-b+/− (n = 6) and cbl-b−/− (n = 7) mice. 2.5 × 10⁵ TC-1 cells were injected into the flanks of 8–12-wk-old littermate mice, and tumor volume was measured with a caliper (mm3) over time (days). Of note, only mice that developed a palpable tumor were included in the experimental cohorts. (B) Kaplan-Meier survival curves of cbl-b+/+ (n = 18), cbl-b+/− (n = 11), and cbl-b−/− (n = 28) mice inoculated with 2.5 × 10⁵ TC-1 tumor cells. Data are pooled from four different experiments. (C) Representative histology of TC-1 tumors isolated on different days (, , and 21 d after inoculation) from cbl-b+/+ and cbl-b−/− mice. Hematoxylin and eosin staining. Arrows point at tumor mass. Bars, 1 mm. (D) Macroscopic appearance of TC-1 tumors in 5 different cbl-b+/+ and 5 different cbl-b−/− mice 21 d (d21) after inoculation.
Figure 2.
Figure 2.
Infiltration of CD8+ T cells into tumors from cbl-b−/− mice. (A) Immunohistochemistry for proliferation marker Ki67 in TC-1 tumor samples from cbl-b+/+ and cbl-b−/− mice 7 and 14 d after tumor inoculation (2.5 × 10⁵). (B) Increased cell death in tumor tissue from cbl-b−/− mice 14 d after TC-1 tumor cell injection. Cell death was determined by TUNEL. Representative images of individual mice on day 7 and 14 are shown. (C) Analysis of tumor-infiltrating lymphocytes 17 (left) and 21 d (right) after TC-1 inoculation into cbl-b+/+ and cbl-b−/− mice. Single-cell suspensions were analyzed by flow cytometry using antibodies reactive to CD8β and CD4. Numbers indicate percentages of cells within the R1 and R2 gates. Bars, 100 μm.
Figure 3.
Figure 3.
CD8+ cells mediate spontaneous tumor rejection independent of CD4+ T cell help. (A) INFγ production of CD8+ T cells isolated from draining and nondraining inguinal lymph nodes of tumor-bearing cbl-b+/+ and cbl-b−/− mice (n = 5) and naive control mice (n = 3). Data are from 21 d after tumor inoculation. Purified CD8β+ T cells were restimulated for 60 h with the HPV-16–derived peptide E749–57, stained for intracellular IFNγ, and analyzed by flow cytometry. Numbers indicate percentages of INFγ+ CD8β+ T cells. (B) Kinetics of TC-1 tumor cell growth in cbl-b+/+ (top; n = 6) and cbl-b−/− (bottom; n = 7) mice left untreated or after depletion of CD4+ or CD8+ T cell subsets. 2.5 × 10⁵ TC-1 cells were injected into the flanks of 8–12-wk-old mice, and tumor volume was measured with a caliper (mm3) over time (days). Only mice that developed a palpable tumor were included in the experimental cohorts.
Figure 4.
Figure 4.
Therapeutic transfer of naive cbl-b−/− CD8+ T cells is sufficient to mediate spontaneous rejection of established tumors. (A) rag2−/− mice were subcutaneously injected with 2.5 × 10⁵ TC-1 cells. At day 3 and 6 after tumor cell injection, purified CD8+ cells from naive cbl-b−/− and cbl-b+/+ mice were adoptively transferred (i.v.) into the tumor-bearing rag2−/− mice (arrows). n = 5 per group. The rag2−/− control group (n = 4) received tumor cells, but no donor T cells. (top) Representative tumor sizes at the end of the experiment. (bottom) The kinetics of tumor growth. (B) Relative percentages of CD3+CD8β+ cbl-b+/+ and CD3+CD8β+ cbl-b−/− T cells in the blood of adoptively transferred rag2−/− mice carrying TC-1 tumors. Representative flow cytometry data show CD3+CD8β+ T cell populations on day 7 after the second T cell transfer (day 13 after the first TC-1 injection).
Figure 5.
Figure 5.
Tumor escape and long-lasting antitumor memory in cbl-b−/− mice. (A and B) Escape of cbl-b−/− mouse–derived TC-1 tumors. Tumor cell lines were generated from TC-1 tumors growing in cbl-b+/− mice (A) or generated from late-onset TC-1 tumors growing in cbl-b−/− mice (B). Tumor cells were injected (2.5 × 10⁵) into 8–12-wk-old, naive, Cbl-b expressing control mice, and cbl-b−/− recipients. Kinetics of tumor growth was analyzed over the indicated time period. Graphs represent data from two pooled experiment of cbl-b+/+ and cbl-b+/− (n = 10 for both cell lines) mice and cbl-b−/− mice (n = 7 for cbl-b+/−-derived tumor cells; n = 10 for cbl-b−/−-derived tumor cells). Of note, the kinetics of tumor growth was comparable between cbl-b+/+ and cbl-b+/− mice. (C and D) Antitumor memory. Cbl-b−/− mice, which had received 2.5 × 10⁵ TC-1 cells at 8–12 wk of age and stayed tumor free after rejection of the initial cancer, were kept under observation for 1 yr after TC-1 injection. These experienced (exp) cbl-b−/− mice, together with age-matched naive cbl-b−/− and age-matched naive cbl-b+/+ and cbl-b+/− control mice, were rechallenged with a 10 times higher dose of TC-1 cells (2.5 × 10⁶). (C) Appearance of representative tumors from each experimental cohort. Tumors were imaged 23 d after injection of 2.5 × 10⁶ TC-1 cells. (D) Kinetics of TC-1 tumor cell growth in age-matched naive cbl-b+/+ and cbl-b+/− control mice (n = 5), naive cbl-b−/− mice (n = 6), and experienced (exp) cbl-b−/− mice (n = 6). 2.5 × 10⁶ TC-1 cells were injected into the flanks of 14-mo-old mice, and tumor volume was measured with a caliper (mm3) over time (days). Of note, only mice that developed a palpable tumor were included in the experimental cohorts.
Figure 6.
Figure 6.
cbl-b−/− effector CD8+ T cells are resistant to CD4+CD25+ T reg cell suppression. (A) Numbers of tumor infiltration for CD4+CD25+, FoxP3+, and CD8+ cells per 106 tumor cells in cbl-b−/− (n = 4 tumors) and cbl-b+/+ (n = 6 tumors) mice. Data are shown as the mean ± the SEM. Proliferation of wild-type CD8+ effector T cells (B) and proliferation of cbl-b−/− CD8+ effector T cells in the presence of cbl-b+/+ and cbl-b−/− CD4+CD25+ T reg cells at various T reg cell/Teff concentrations (C). Proliferation in B and C was measured by [3H]thymidine incorporation for the last 12 h of a 72-h stimulation with anti-CD3ɛ. Data (mean values of a triplicate culture ± the SEM) are from one out of three different experiments with similar results. (D) Percent suppression of proliferation of CD8+ effector T cells from cbl-b−/− and cbl-b+/+ mice by cbl-b+/+ (WT) and cbl-b−/− (KO) T reg cells at various T reg cell/Teff concentrations.
Figure 7.
Figure 7.
cbl-b−/− mice show significantly decreased susceptibility to spontaneous UVB-induced skin cancer. (A) Kaplan-Meier curves of tumor-bearing cbl-b+/+ (n = 18) and cbl-b−/− (n = 21) mice during chronic UVB irradiation. Tumor incidence in the cbl-b−/− cohort was significantly reduced compared with cbl-b+/+ mice (*, P < 0.05 from day 363 and P < 0.001 from day 377 onward; log-rank test). (B) Confocal images of cbl-b−/− and cbl-b+/+ skin tumor sections stained for CD8+ cells by immunofluorescence. Bars, 25 μm. (C) Representative UVB-induced tumor growth in one wild-type (left) and one cbl-b−/− mouse (right). Tumor growth is shown over time in the same two mice (days after first UVB irradiation is indicated) Note the progressive reduction of tumor mass in the cbl-b−/− mouse. Insets are higher magnifications of tumors. Histology confirmed epithelial origin of the tumors in control and cbl-b−/− mice.
Figure 8.
Figure 8.
Depletion of CD8+ cells in UVB-treated cbl-b−/− mice leads to rapid tumor outgrowth. (A) Kinetics of progressive tumor growth inindividual CD8+ cell–depleted, UVB-treated cbl-b−/− (n = 4), and IgG control-treated UVB-treated cbl-b−/− (n = 4) mice. Depletion was performed 130 d after the last UVB treatment. Only mice that received UVB treatment for 9 mo, but did not develop skin cancer, were included in this experiment. Tumor volume in millimeters3 was measured over a period of days. Shapes represent individual mice. (B) Representative UVB-induced tumor growth in one IgG-treated cbl-b−/− mouse (left) and one CD8+ cell–depleted cbl-b−/− mouse (right) imaged 22 d after initial depletion.

Similar articles

Cited by

References

    1. Pardoll, D.M. 1993. New strategies for enhancing the immunogenicity of tumors. Curr. Opin. Immunol. 5:719–725. - PubMed
    1. Burnet, F.M. 1970. The concept of immunological surveillance. Prog. Exp. Tumor Res. 13:1–27. - PubMed
    1. Dunn, G.P., L.J. Old, and R.D. Schreiber. 2004. The immunobiology of cancer immunosurveillance and immunoediting. Immunity. 21:137–148. - PubMed
    1. Staveley-O'Carroll, K., E. Sotomayor, J. Montgomery, I. Borrello, L. Hwang, S. Fein, D. Pardoll, and H. Levitsky. 1998. Induction of antigen-specific T cell anergy: an early event in the course of tumor progression. Proc. Natl. Acad. Sci. USA. 95:1178–1183. - PMC - PubMed
    1. Speiser, D.E., R. Miranda, A. Zakarian, M.F. Bachmann, K. McKall-Faienza, B. Odermatt, D. Hanahan, R.M. Zinkernagel, and P.S. Ohashi. 1997. Self antigens expressed by solid tumors do not efficiently stimulate naive or activated T cells: implications for immunotherapy. J. Exp. Med. 186:645–653. - PMC - PubMed

Publication types

MeSH terms

Substances