. 2007 Apr 15;178(8):5217-26.
doi: 10.4049/jimmunol.178.8.5217.

Dynamic relationship between IFN-gamma and IL-2 profile of Mycobacterium tuberculosis-specific T cells and antigen load

Affiliations

Dynamic relationship between IFN-gamma and IL-2 profile of Mycobacterium tuberculosis-specific T cells and antigen load

Kerry A Millington et al. J Immunol. .

Abstract

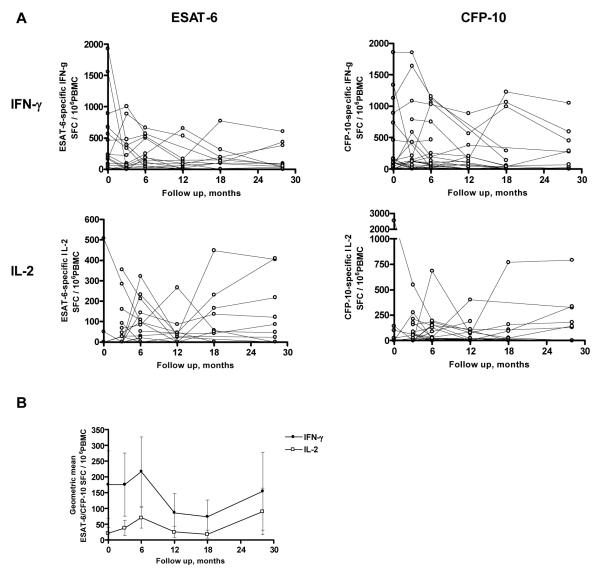
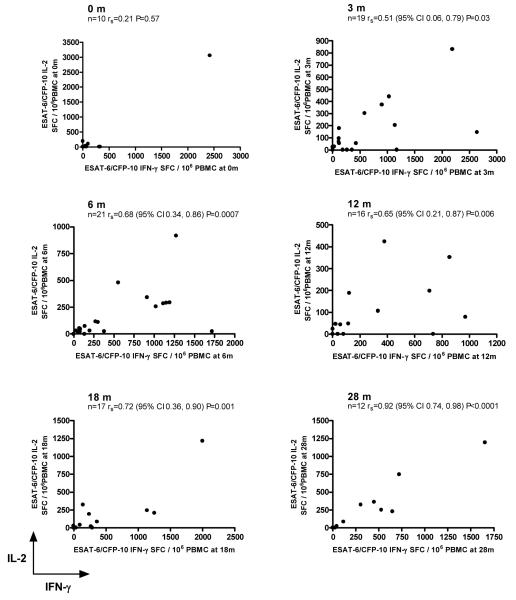
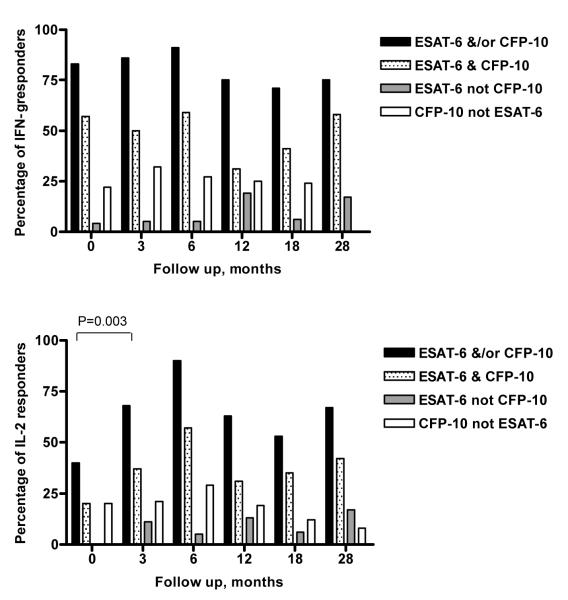
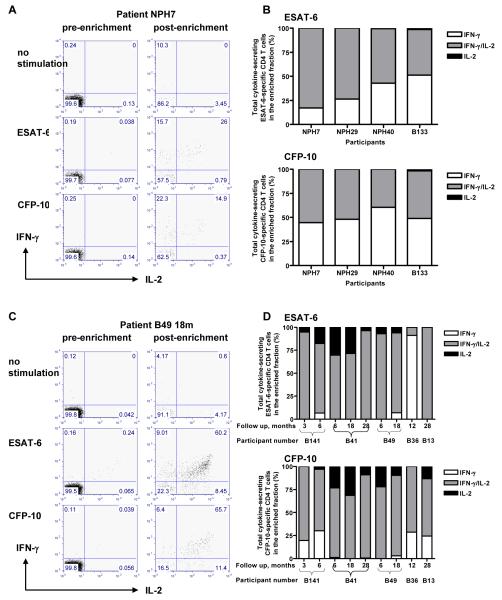
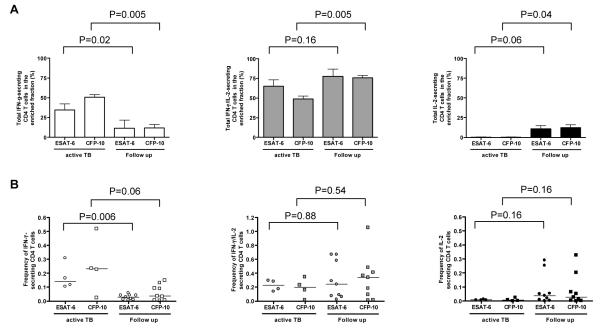
Distinct IFN-gamma and IL-2 profiles of Ag-specific CD4(+) T cells have recently been associated with different clinical disease states and Ag loads in viral infections. We assessed the kinetics and functional profile of Mycobacterium tuberculosis Ag-specific T cells secreting IFN-gamma and IL-2 in 23 patients with untreated active tuberculosis when bacterial and Ag loads are high and after curative treatment, when Ag load is reduced. The frequencies of M. tuberculosis Ag-specific IFN-gamma-secreting T cells declined during 28 mo of follow-up with an average percentage decline of 5.8% per year (p = 0.005), while the frequencies of Ag-specific IL-2-secreting T cells increased during treatment (p = 0.02). These contrasting dynamics for the two cytokines led to a progressive convergence of the frequencies of IFN-gamma- and IL-2-secreting cells over 28 mo. Simultaneous measurement of IFN-gamma and IL-2 secretion at the single-cell level revealed a codominance of IFN-gamma-only secreting and IFN-gamma/IL-2 dual secreting CD4(+) T cells in active disease that shifted to dominance of IFN-gamma/IL-2-secreting CD4(+) T cells and newly detectable IL-2-only secreting CD4(+) T cells during and after treatment. These distinct T cell functional signatures before and after treatment suggest a novel immunological marker of mycobacterial load and clinical status in tuberculosis that now requires validation in larger prospective studies.


Figures

Figure 1
Figure 1
Frequencies of ESAT-6 and CFP-10-specific IFN-γ and IL-2-secreting T cells in 23 patients with active tuberculosis followed up for 28 months during and after successful treatment. Frequencies of ESAT-6 and CFP-10-specific IFN-γ and IL-2-secreting T cells were enumerated by ex vivo ELISpot at 0, 3, 6, 12, 18 and 28 months after diagnosis of active tuberculosis disease (A); geometric means of ESAT-6/CFP-10-specific IFN-γ and IL-2 SFCs (B).
Figure 2
Figure 2
Correlation between ESAT-6/CFP-10-specific IFN-γ and IL-2-secreting T cells measured separately with the ex vivo IFN-γ and IL-2 ELISpot assays at 0, 3, 6, 12, 18 and 28 months of follow up. There is an increasing positive association between the frequency of T cells secreting IFN-γ and the frequency of T cells secreting IL-2 at corresponding timepoints during follow up.
Figure 3
Figure 3
Proportion of patients with IFN-γ or IL-2-secreting T cells as defined by a positive ex vivo ELISpot response, in active tuberculosis and during follow up. The percentage of patients that responded to ESAT-6 and/or CFP-10, ESAT-6 and CFP-10, ESAT-6 alone or CFP-10 alone is shown.
Figure 4
Figure 4
The IFN-γ and IL-2 cytokine profile of CD4+ T cells in active tuberculosis and during and after anti-tuberculosis therapy. Representative dot plots from an active tuberculosis patient (A) and from a different patient 18 months after initiation of treatment (C). Percentages plotted indicate the relative proportions of CD4+ cells producing IFN-γ and/or IL-2 in the enriched fraction with background levels of non-specific cytokine production subtracted in active tuberculosis (B) and during follow up (D). ESAT-6 and CFP-10-specific IFN-γ and IFN-γ/IL-2-secreting CD4+ T cells co-dominated in active tuberculosis, when bacterial load was high whilst IFN-γ/IL-2-secreting T cells dominated during and after treatment when viable bacterial load was reduced or cleared, with the loss of IFN-γ only secreting CD4+ T cells and the appearance of IL-2-secreting CD4+ T cells. This data was reproducibly observed in 4 active tuberculosis cases pre-treatment and in 5 patients at 9 follow up time points in total during and after their treatment. The 4 active tuberculosis cases and 3 follow up patients had pulmonary disease and the remaining follow up patients had lymphatic disease.
Figure 5
Figure 5
The proportion and frequency of ESAT-6 and CFP-10-specific CD4+ T cell IFN-γ and/or IL-2 responses in active tuberculosis compared to follow up timepoints (during and after treatment). The proportion of ESAT-6 and CFP-10-specific CD4+ T cell secreting IFN-γ and/or IL-2 in the enriched fraction (A) and frequencies of these cells as determined after magnetic enrichment of IFN-γ and IL-2-secreting cells (B) where the horizontal lines indicate the median positive response. The P values indicate whether there is a statistical difference between active tuberculosis and follow up.

References

    1. Sprent J, Surh CD. T cell memory. Annu Rev Immunol. 2002;20:551–579. - PubMed
    1. Seder RA, Ahmed R. Similarities and differences in CD4+ and CD8+ effector and memory T cell generation. Nat Immunol. 2003;4:835–842. - PubMed
    1. Ahmed R, Gray D. Immunological memory and protective immunity: understanding their relation. Science. 1996;272:54–60. - PubMed
    1. Lanzavecchia A, Sallusto F. Dynamics of T lymphocyte responses: intermediates, effectors, and memory cells. Science. 2000;290:92–97. - PubMed
    1. Lanzavecchia A, Sallusto F. Progressive differentiation and selection of the fittest in the immune response. Nat Rev Immunol. 2002;2:982–987. - PubMed

Publication types

Substances