. 2007 Apr 4;2(4):e358.
doi: 10.1371/journal.pone.0000358.

Modular mass spectrometric tool for analysis of composition and phosphorylation of protein complexes

Affiliations

Modular mass spectrometric tool for analysis of composition and phosphorylation of protein complexes

Justin D Blethrow et al. PLoS One. .

Abstract

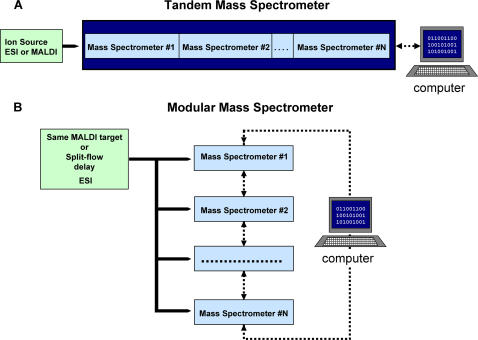
The combination of high accuracy, sensitivity and speed of single and multiple-stage mass spectrometric analyses enables the collection of comprehensive sets of data containing detailed information about complex biological samples. To achieve these properties, we combined two high-performance matrix-assisted laser desorption ionization mass analyzers in one modular mass spectrometric tool, and applied this tool for dissecting the composition and post-translational modifications of protein complexes. As an example of this approach, we here present studies of the Saccharomyces cerevisiae anaphase-promoting complexes (APC) and elucidation of phosphorylation sites on its components. In general, the modular concept we describe could be useful for assembling mass spectrometers operating with both matrix-assisted laser desorption ionization (MALDI) and electrospray ionization (ESI) ion sources into powerful mass spectrometric tools for the comprehensive analysis of complex biological samples.


Conflict of interest statement

Competing Interests: The authors of the article, except AK, have no competing financial interests. AK declares a competing financial interest. ThermoElectron and Perkin Elmer license the rights to produce some parts of the MALDI interfaces for vMALDI-IT and prOTOF mass spectrometers. AK is a co-author of several patents covering these parts.

Figures

Figure 1
Figure 1
Schematic diagrams of (A) a tandem mass spectrometer, and (B) a modular mass spectrometer.
Figure 2
Figure 2
Combined performances of a prOTOF and a vMALDI-LTQ mass spectrometers as one modular tool. (A) prOTOF-MALDI-MS spectrum of a 1 femtomole mixture of six peptides, obtained in 30 seconds of spectrum acquisition time. The measurements of the m/z values of the peptides were performed using an external instrument calibration. The monoisotopic resolution for the detected ion peaks as well as the calculated (c) and the experimental (e) m/z values are shown. The peptides are bradykinin (fragment 2–9: PPGFSPFR, m/z = 904.468, theoretical value), Substance P (RPKPQQFFGLM-NH2, m/z = 1347.736), neurotensin (pELYENKPRRPYIL, m/z = 1672.918), amyloid β-protein (fragment 12–28: VHHQKLVFFAEDVGSNK, m/z = 1955.014), ACTH (SYSMEHFRWGKPVGKKRRPVKVYP, m/z = 2932.588), and B chain of oxidized insulin (FVNQHLC(O3)GSHLVEALYLVC(O3)GERGFFYTPKA, m/z = 3494.651). (B) vMALDI-LTQ MS/MS spectra of all 6 detected peptides. All spectra were measured in 2–3 seconds after the automatic collection of the MS/MS spectra. The interpretation of the observed fragmentation spectra and the identity of the observed peptides are indicated in each panel.
Figure 3
Figure 3
The flow of steps in the experiments for characterization of the subunits of the S. cerevisiae APC with a modular mass spectrometric tool.
Figure 4
Figure 4
(A) A map of neutral losses of 98 Da detected in all MS/MS spectra obtained from the sample shown in Fig. 3. The APC was purified from ∼(2–4)×1010 cells. (B) A map of neutral losses of 98 Da detected in all MS/MS spectra obtained from APC purified from a large culture of about 1011 cells. All peaks with signal-to-noise ratios above 10-to-1 were examined by MS/MS and MS/MS/MS to confirm the loss of 98 Da and to identify the phosphopeptides and plausible position of a phosphate group. Peaks indicated with an asterisk were not identified. (C) Summary of the identified phosphopeptides from proteins co-immunopurified with the Cdc16-3xFlag-6xH protein.
Figure 5
Figure 5
(A) An MS/MS spectrum of a phosphopeptide detected at m/z 2789.245. The loss of 98 Da, which is a specific signature of phosphorylation, is indicated. (B) MS/MS/MS of the fragment that lost 98 Da. The identity of the phosphopeptide and the plausible location of the residue which lost the phosphate group are shown in the panel.

References

    1. Yost R, Enke RK. Selected ion fragmentation with a tandem quadrupole mass spectrometer. J. Am. Chem. Soc. 1978;100:2274–2275.
    1. Yost RA, Boyd RK. Tandem Mass spectrometry: quadrupole and hybrid instruments. Methods Enzymol. 1990;193:154–200. - PubMed
    1. Chernushevich IV, Loboda AV, Thomson BA. An introduction to quadrupole-time-of-flight mass spectrometry. J Mass Spectrom. 2001;36:849–65. - PubMed
    1. Hager JW. A new linear ion trap mass spectrometer. Rapid Commun. Mass Spectrom. 2002;16:512–526. - PubMed
    1. Vestal ML, Campbell JM. Tandem time-of-flight mass spectrometry. Methods Enzymol. 2005;402:79–108. - PubMed

Publication types

MeSH terms

Substances