. 2007 May;9(5):403-15.
doi: 10.1002/jgm.1028.

Prolonged expression of a lysosomal enzyme in mouse liver after Sleeping Beauty transposon-mediated gene delivery: implications for non-viral gene therapy of mucopolysaccharidoses

Affiliations

Prolonged expression of a lysosomal enzyme in mouse liver after Sleeping Beauty transposon-mediated gene delivery: implications for non-viral gene therapy of mucopolysaccharidoses

Elena L Aronovich et al. J Gene Med. 2007 May.

Abstract

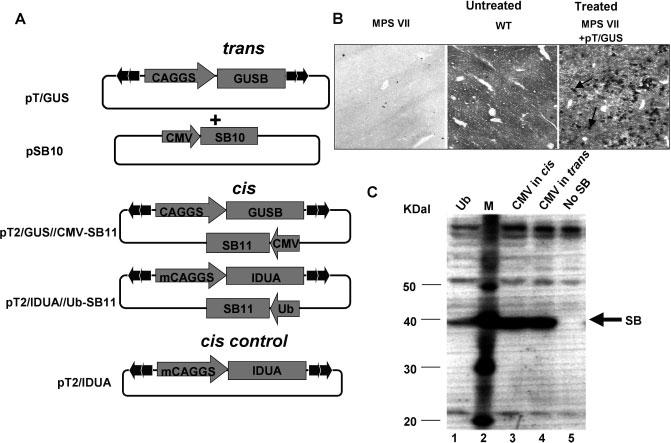
Background: The Sleeping Beauty (SB) transposon system is a non-viral vector system that can integrate precise sequences into chromosomes. We evaluated the SB transposon system as a tool for gene therapy of mucopolysaccharidosis (MPS) types I and VII.

Methods: We constructed SB transposon plasmids for high-level expression of human beta-glucuronidase (hGUSB) or alpha-L-iduronidase (hIDUA). Plasmids were delivered with and without SB transposase to mouse liver by rapid, high-volume tail-vein injection. We studied the duration of expressed therapeutic enzyme activity, transgene presence by PCR, lysosomal pathology by toluidine blue staining and cell-mediated immune response histologically and by immunohistochemical staining.

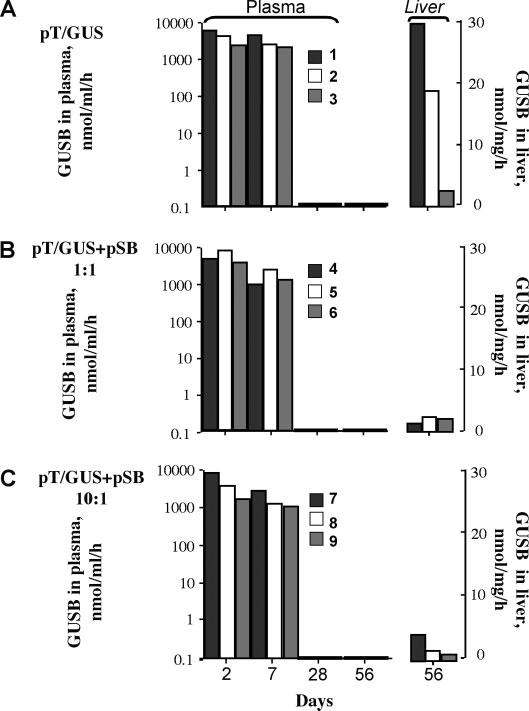
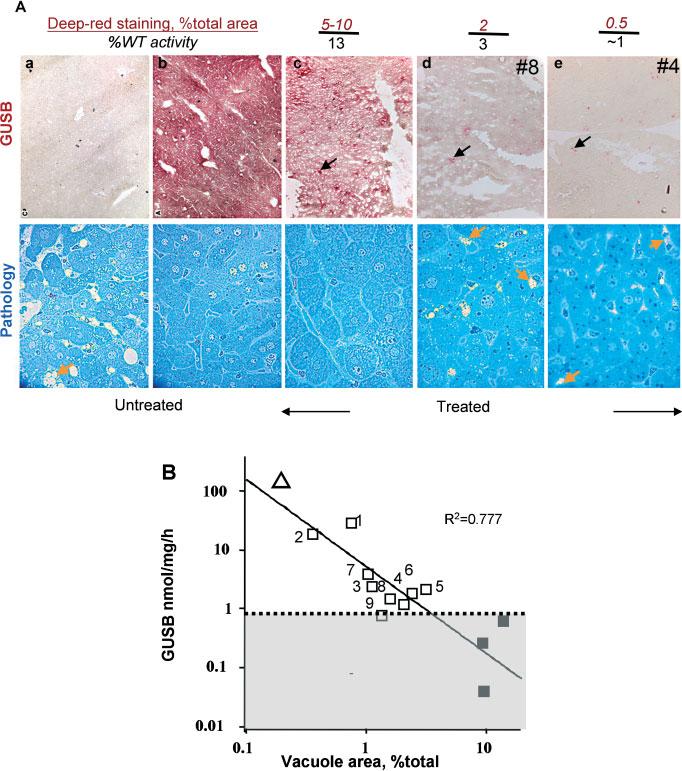
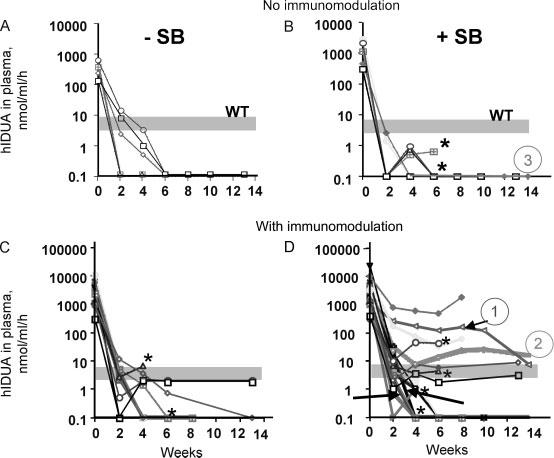
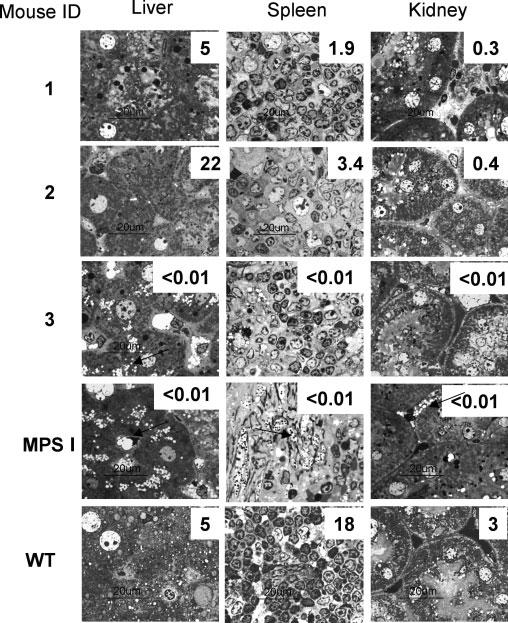
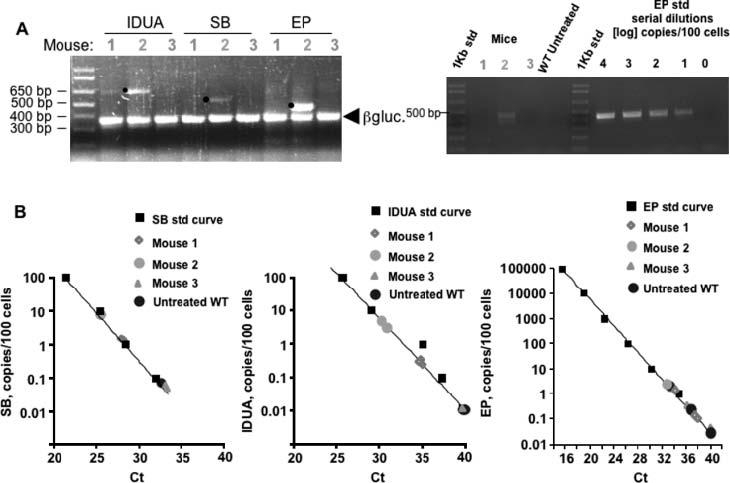
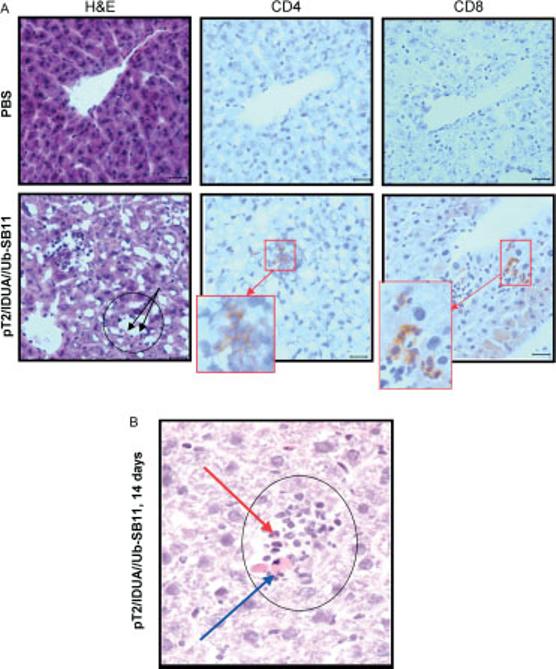
Results: Transgene frequency, distribution of transgene and enzyme expression in liver and the level of transgenic enzyme required for amelioration of lysosomal pathology were estimated in MPS I and VII mice. Without immunomodulation, initial GUSB and IDUA activities in plasma reached > 100-fold of wild-type (WT) levels but fell to background within 4 weeks post-injection. In immunomodulated transposon-treated MPS I mice plasma IDUA persisted for over 3 months at up to 100-fold WT activity in one-third of MPS I mice, which was sufficient to reverse lysosomal pathology in the liver and, partially, in distant organs. Histological and immunohistochemical examination of liver sections in IDUA transposon-treated WT mice revealed inflammation 10 days post-injection consisting predominantly of mononuclear cells, some of which were CD4- or CD8-positive.

Conclusions: Our results demonstrate the feasibility of achieving prolonged expression of lysosomal enzymes in the liver and reversing MPS disease in adult mice with a single dose of therapeutic SB transposons.


Figures

Figure 1
Figure 1
hGUSB and hIDUA transposon vectors. (A) The inverted terminal repeats (ITRs) of the transposon are indicated by arrowheads; pT/GUS contains the complete hGUSB cDNA inserted between two EcoRI sites of the CAGGS polylinker [27]; pSB10 serves as a source for SB transposase in trans [11]. The cis-constructs pT2/IDUA//Ub-SB11 and pT2/GUS//CMV-SB11 contain T2 transposon ITRs and an SB11 expression cassette inserted outside of the transposon; m(mini)CAGGS is a CAGGS version with a shortened intron [14]. (B) Histochemical staining for GUSB in mouse liver frozen sections. Untreated MPS VII (left), WT (middle) and transposon-treated MPS VII mice 2 days after injection of 25 μg pT/GUS (right). Deeply red-stained foci seen in the right panel (indicated by arrows) are GUSB-expressing cells. (C) Western blot demonstrating expression of SB transposase protein using different constructs containing either a strong (CMV) or an intermediate-strength (Ub) promoter. Lane 1, pT2/IDUA//Ub-SB11; lane 2, MagicMark™ XP Western Protein Standard; lane 3, pT2/GUS//CMV-SB11; lane 4, pSB10; lane 5, pT/GUS (no SB)
Figure 2
Figure 2
Duration of GUSB expression in SB transposon-treated MPS VII mice. GUSB activity in three treatment groups was assayed in plasma at 2, 7, 28 and 56 days and in the liver at 56 days (8 weeks) post-injection: (A) mice 1–3, transposon pT/GUS alone; (B) mice 4–6, transposon pT/GUS plus pSB10 transposase at equimolar ratio of injected plasmids; (C) mice 7–9, 10 : 1 transposon/transposase plasmid molar ratio. The legend shows mouse numbers
Figure 3
Figure 3
GUSB expression in the liver and hepatic lysosomal pathology 8 weeks after pT/GUS delivery. (A) Top panel: histochemical staining for GUSB in liver sections. The percentage of deep-red stained GUSB-expressing cells was determined by image analysis as described in the ‘Materials and methods’ section. %WT activity was calculated as the percentage of GUSB activity determined by the fluorometric enzyme assay in liver homogenates of the treated mice compared to the WT mean determined in this experiment (measurements are ±0.5% WT). Examples of deeply stained GUSB-positive cells are indicated by black arrows. Bottom panel: lysosomal distention revealed by toluidine blue staining of corresponding livers. Examples of storage vacuoles are indicated by yellow arrows, which show typical lysosomal pathology. (a) untreated MPS VII; (b) WT; (c) MPSVII mouse #2 (treated with pT/GUS; GUSB activity in the liver 18.6 nmol/mg/h); (d, e) representative liver sections from mice #8 and #4, with GUSB activities in liver homogenates of approximately 3% and 1% WT, respectively. (B) Correlation between GUSB activity in liver homogenates and the degree of lysosomal pathology in the corresponding liver. Vacuole area was quantified as described in the ‘Materials and methods’ section. Mouse ID numbers on the plot correspond to those in Figure 2; untreated WT (unfilled large triangle) and MPS VII sham-treated mice (filled squares). All others (unfilled squares) are MPSVII mice treated with pT/GUS transposon with or without pSB10. Shaded area below the dotted line shows background activity due to fluorescence ‘noise’. The solid line is the best fit from linear regression analysis
Figure 4
Figure 4
Duration of IDUA expression in treated MPS I mice. MPS I mice were hydrodynamically injected with either pT2/IDUA, which lacks an SB transposase gene (A, C), or with pT2/IDUA//Ub-SB11 (B, D). Blood was collected by retro-orbital phlebotomy on day 1 and every 2 weeks post-injection for quantifying IDUA activity in plasma. Mice in (A) and (B) were not immunomodulated. Mice in (B) show the pooled results from two experiments, 13 and 14 weeks in duration. (C) Results of two experiments, 8 and 13 weeks in duration, in which all mice were immunosuppressed with cyclophosphamide. (D) Pooled results from three experiments, 8, 13 and 14 weeks. The wide, shaded grey bar shows the range of IDUA activity in WT plasma. The arrows in (D) indicate three mice that were administered GdCl3 pretreatment. Asterisks indicate mice that died. Mice that were analyzed in more detail are indicated by circled numbers with the same colors as the lines on the graph. Mouse 1 (red) and mouse 2 (green, thick green line) in (D) were immunomodulated with GdCl3 and cyclophosphamide, respectively. Mouse 3 (pink) in (B) was not immunomodulated. In summary, out of a total of 22 mice in (D), 17 were immunosuppressed with cyclophosphamide and 5 mice (30% of surviving 18 mice) exhibited long-term expression. Two of these mice died 4 weeks post-injection, and two mice died 6 weeks post-injection following retro-orbital bleeding. Three mice in (D) (arrows) were pretreated with GdCl3; one of these mice exhibited long-term expression, all survived throughout the duration of the experiment
Figure 5
Figure 5
Correction of lysosomal pathology in parenchymal organs of MPS I mice 14 weeks after IDUA gene delivery. Light microscopy of representative toluidine blue stained sections at 1000× magnification. Arrows point to examples of lysosomal pathology represented by cytoplasmic vacuolation. ID numbers indicate mice discussed in the text. Plasma IDUA levels for individual mice are shown in Figures 4B and 4D. Numbers superimposed on tissue sections indicate IDUA residual activity in nmol/mg/h in the homogenate prepared from the indicated organ. Magnification bars = 20 μm
Figure 6
Figure 6
Transgene maintenance in treated MPS I mice. (A) Left, conventional PCR for the hIDUA and SB transgenes and plasmid excision product (EP) from transposition using 100 ng total liver DNA isolated from mouse 1 (immunomodulated with GdCl3), mouse 2 (immunosuppressed with cyclophosphamide) and mouse 3 (not immunomodulated) shown in Figure 4. All of these mice were treated with pT2/IDUA//Ub-SB11 transposon in cis and sacrificed 14 weeks post-injection. Mouse 1 maintained stable IDUA activity between 2 and 10 weeks post-injection, but at 14 weeks IDUA activity declined approximately 20-fold. Mouse 2 maintained stable IDUA levels throughout the duration of the experiment while mouse 3 lost IDUA activity in plasma by 4 weeks post-injection. Plasma IDUA levels for individual mice are shown in (B) and (D). Note that EP was amplified in two rounds of PCR, the photo showing the product of secondary amplification using nested primers as described in the ‘Materials and methods’ section. Murine genomic β-glucuronidase was co-amplified as an internal control. Bullets indicate products of expected sizes for each set of PCR primers. Right, EP DNA from mice 1, 2 and 3 and serial dilution curve made with genomic DNA isolated from mouse liver 24 h after rapid high-volume tail-vein injection of 25 μg of the mock EP plasmid at the end-point of real-time PCR (40 cycles), resolved by 1% agarose gel electrophoresis. (B) qPCR quantification of SB and IDUA genes and EP plasmids. Standard curves were obtained using cells that contained either one copy of IDUA or SB gene or 1000 EP plasmids per cell. The log concentrations of the samples are plotted against the threshold cycle number (Ct). Linear regression analysis is shown as a solid line. Experimental Ct values for mice 1, 2 and 3, as well as the standard curve, were obtained in the same PCR run. All reactions were run in triplicate
Figure 7
Figure 7
Inflammatory infiltrates in hIDUA transposon-treated mice. pT2/hIDUA//Ub-SB11 (25 μg, bottom panels) was hydrodynamically injected into WT C57BL/6 mice with PBS-administered animals serving as controls (top panels). Serial 4-μm sections from each liver were analyzed for the presence of inflammation and loss of hepatocytes (H&E stain), and for the presence of CD4+ and CD8+ lymphocytes (IHC). Black circles indicate inflammatory cell aggregates. Blue arrow points to apoptotic hepatocytes; red arrow indicates a neutrophil in the H&E section. Magnification bars = 25 μm. (A) Representative examples of liver sections 10 days post-injection. CD4- or CD8-positive lymphocytes (brownish-red cells) in the IHC sections counterstained with hematoxylin are outlined and shown at higher magnification (inserts in red boxes). (B) A representative example of an inflammatory infiltrate (14 days post-injection)

Similar articles

Cited by

References

    1. Neufeld EF, Muenzer J. The mucopolysaccharidoses. In: Scriver CR, Beaudet AL, Sly WS, et al., editors. The Metabolic and Molecular Bases of Inherited Disease. 8th edn III. McGraw-Hill; New York: 2001. pp. 3427–3436.
    1. Sly WS. Enzyme replacement therapy: from concept to clinical practice. Acta Paediatr Suppl. 2002;91:71–78. - PubMed
    1. Wraith JE. Limitations of enzyme replacement therapy: current and future. J Inherit Metab Dis. 2006;29:442–447. - PubMed
    1. Whitley CB, Belani KG, Chang PN, et al. Long-term outcome of Hurler syndrome following bone marrow transplantation. Am J Med Genet. 1993;46:209–218. - PubMed
    1. Krivit W, Aubourg P, Shapiro E, Peters C. Bone marrow transplantation for globoid cell leukodystrophy, adrenoleukodystrophy, metachromatic leukodystrophy, and Hurler syndrome. Curr Opin Hematol. 1999;6:377–382. - PubMed

Publication types