. 2007;8(4):R45.
doi: 10.1186/gb-2007-8-4-r45.

Porcine transcriptome analysis based on 97 non-normalized cDNA libraries and assembly of 1,021,891 expressed sequence tags

Affiliations

Porcine transcriptome analysis based on 97 non-normalized cDNA libraries and assembly of 1,021,891 expressed sequence tags

Jan Gorodkin et al. Genome Biol. 2007.

Abstract

Background: Knowledge of the structure of gene expression is essential for mammalian transcriptomics research. We analyzed a collection of more than one million porcine expressed sequence tags (ESTs), of which two-thirds were generated in the Sino-Danish Pig Genome Project and one-third are from public databases. The Sino-Danish ESTs were generated from one normalized and 97 non-normalized cDNA libraries representing 35 different tissues and three developmental stages.

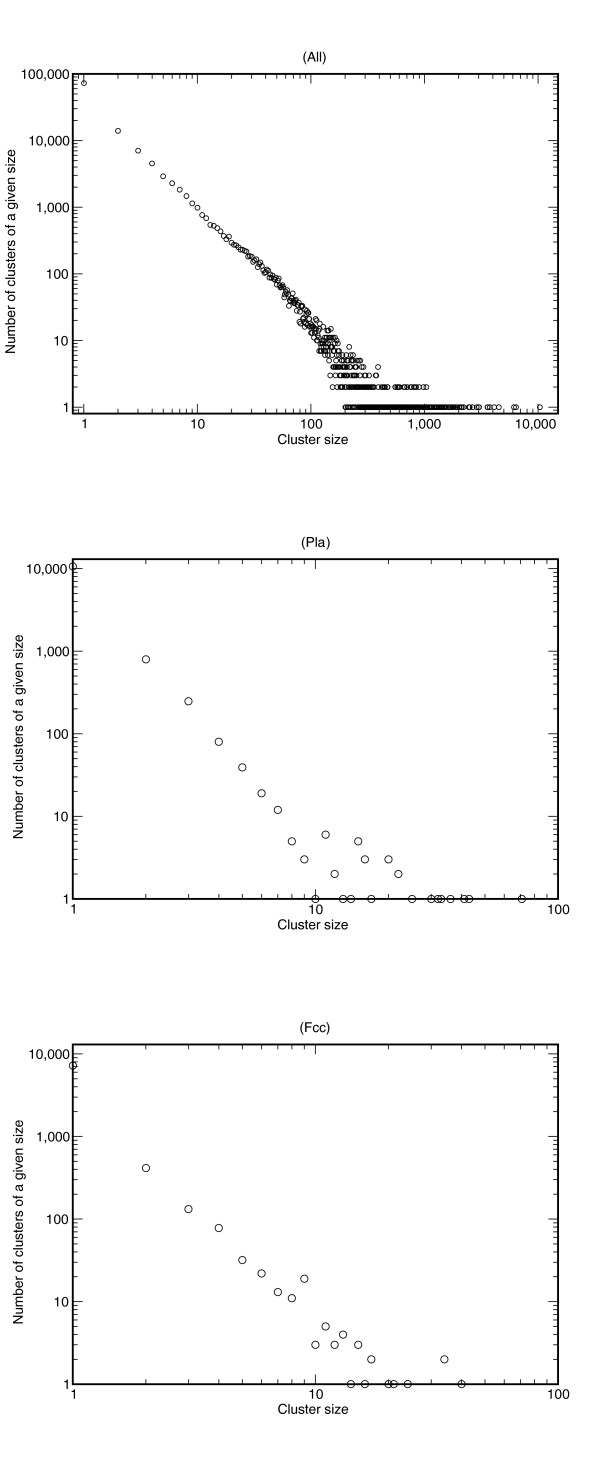
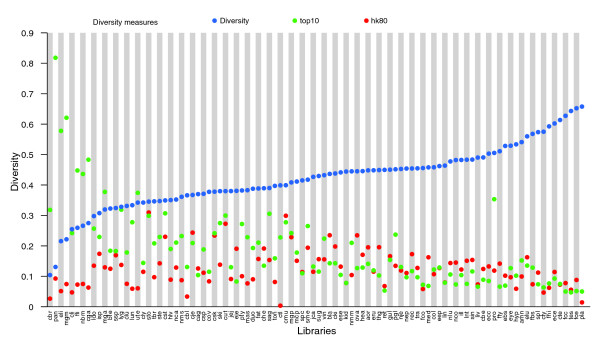
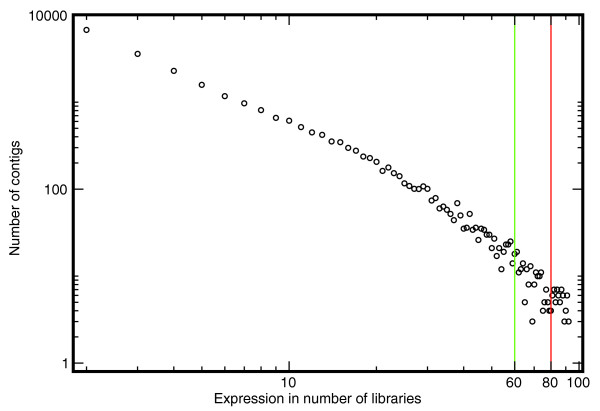
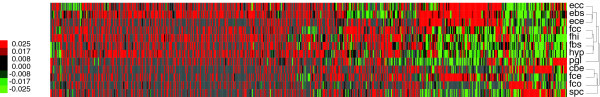
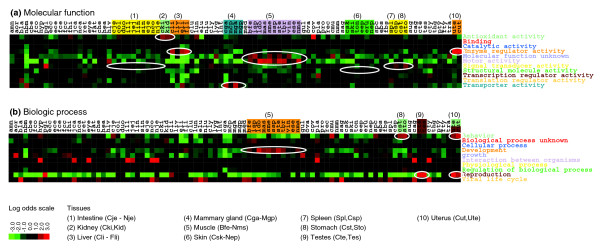
Results: Using the Distiller package, the ESTs were assembled to roughly 48,000 contigs and 73,000 singletons, of which approximately 25% have a high confidence match to UniProt. Approximately 6,000 new porcine gene clusters were identified. Expression analysis based on the non-normalized libraries resulted in the following findings. The distribution of cluster sizes is scaling invariant. Brain and testes are among the tissues with the greatest number of different expressed genes, whereas tissues with more specialized function, such as developing liver, have fewer expressed genes. There are at least 65 high confidence housekeeping gene candidates and 876 cDNA library-specific gene candidates. We identified differential expression of genes between different tissues, in particular brain/spinal cord, and found patterns of correlation between genes that share expression in pairs of libraries. Finally, there was remarkable agreement in expression between specialized tissues according to Gene Ontology categories.

Conclusion: This EST collection, the largest to date in pig, represents an essential resource for annotation, comparative genomics, assembly of the pig genome sequence, and further porcine transcription studies.


Figures

Figure 1
Figure 1
Distribution of cluster sizes. The number of clusters on the y-axis versus the cluster size (number of reads) on the x-axis exhibit a power law-like region. The distribution marked 'All' indicates the cluster size distribution for the entire dataset, whereas the other distributions are examples from specific libraries: 'Pla' (placenta, normalized) and 'Fcc' (cerebellum F100 days).
Figure 2
Figure 2
Diversity of cDNA libraries. The libraries (x-axis) are ranked according to their diversity (blue dot on y-axis). The names of the libraries on the x-axis correspond to those listed in Table 1. The diversity of a library is computed as the number of conreads in which the library has at least one read included, divided by the total number of reads present in the library. (See Materials and methods, in the text, for further details.) Two additional measures are included as well. 'top10' (green dots) refers to the fraction of reads comprising the 10 most expressed contigs in that particular library. 'hk80' (red dots) refers to the fraction of reads representing the 65 housekeeping candidates expressed in more than 80 libraries listed in Additional data file 1 (Table S2). Brain and testes libraries are among the most diverse. These also appear as the most diverse from the average diversity for each of the 35 tissues (not shown). Note that the normalized library Pla is among the most diverse tissues, as one would expect a normalized library to be.
Figure 3
Figure 3
Distribution of cluster coverage of cDNA libraries. The values on the x-axis indicate the number of libraries for which there is at least one expressed sequence tag (EST) read present. The corresponding value on the y-axis shows the number of conreads for a given number of libraries. The vertical lines at 60 and 80 indicate cut-offs for potential housekeeping genes. The data indicate the presence of power law-like behavior. The data also show that we can only expect a small portion of the clusters to be composed of reads from many libraries.
Figure 4
Figure 4
Patterns of differential expression. Differential expression within brain and spinal cord tissues. The clusterings were made using the package of de Hoon and coworkers [43], with options 'uncentered correlation' and 'average-linkage'. Gray fields indicate that the number of reads did not exceed the read cutoff of four reads for a given contig in a given library. However, such numbers were still counted as having the value zero when centering the expression values for the gene cluster. The tree has arbitrary scale.
Figure 5
Figure 5
Gene Ontology content of cDNA libraries and tissues. A heat map of the log odds values (in bits) for each library, found by comparing the observed fraction of the Gene Ontology top level categories of (a) 'molecular function' and (b) 'biological process' with the respective averages. Gene Ontology categories were taken from corresponding M0 to M3 BLAST matches to UniProt. The libraries are grouped by their corresponding tissues, and the coloring indicates the category where we find higher expression than by chance. Only the relevant tissues are indicated by numbers and listed by their range of cDNA library names.

References

    1. Rohrer GA, Alexander LJ, Hu Z, Smith TP, Keele JW, Beattie CW. A comprehensive map of the porcine genome. Genome Res. 1996;6:371–391. - PubMed
    1. Rink A, Santschi EM, Eyer KM, Roelofs B, Hess M, Godfrey M, Karajusuf EK, Yerle M, Milan D, Beattie CW. A first-generation EST RH comparative map of the porcine and human genome. Mamm Genome. 2002;13:578–587. doi: 10.1007/s00335-002-2192-5. - DOI - PubMed
    1. Wernersson R, Schierup MH, Jørgensen FG, Gorodkin J, Panitz F, Stærfeldt HH, Christensen OF, Mailund T, Hornshoj H, Klein A, et al. Pigs in sequence space: a 0.66X coverage pig genome survey based on shotgun sequencing. BMC Genomics. 2005;6:70. doi: 10.1186/1471-2164-6-70. - DOI - PMC - PubMed
    1. Su A, Wiltshire T, Batalov S, Lapp H, Ching K, Block D, Zhang J, Soden R, Hayakawa M, Kreiman G, et al. A gene atlas of the mouse and human protein-encoding transcriptomes. Proc Natl Acad Sci USA. 2004;101:6062–6067. doi: 10.1073/pnas.0400782101. - DOI - PMC - PubMed
    1. Son C, Bilke S, Davis S, Greer B, Wei J, Whiteford C, Chen Q, Cenacchi N, Khan J. Database of mRNA gene expression profiles of multiple human organs. Genome Res. 2005;15:443–450. doi: 10.1101/gr.3124505. - DOI - PMC - PubMed

Publication types