. 2007 Feb 15:1:12.
doi: 10.1186/1752-0509-1-12.

Bioinformatics strategies for lipidomics analysis: characterization of obesity related hepatic steatosis

Affiliations

Bioinformatics strategies for lipidomics analysis: characterization of obesity related hepatic steatosis

Laxman Yetukuri et al. BMC Syst Biol. .

Abstract

Background: Lipids are an important and highly diverse class of molecules having structural, energy storage and signaling roles. Modern analytical technologies afford screening of many lipid molecular species in parallel. One of the biggest challenges of lipidomics is elucidation of important pathobiological phenomena from the integration of the large amounts of new data becoming available.

Results: We present computational and informatics approaches to study lipid molecular profiles in the context of known metabolic pathways and established pathophysiological responses, utilizing information obtained from modern analytical technologies. In order to facilitate identification of lipids, we compute the scaffold of theoretically possible lipids based on known lipid building blocks such as polar head groups and fatty acids. Each compound entry is linked to the available information on lipid pathways and contains the information that can be utilized for its automated identification from high-throughput UPLC/MS-based lipidomics experiments. The utility of our approach is demonstrated by its application to the lipidomic characterization of the fatty liver of the genetically obese insulin resistant ob/ob mouse model. We investigate the changes of correlation structure of the lipidome using multivariate analysis, as well as reconstruct the pathways for specific molecular species of interest using available lipidomic and gene expression data.

Conclusion: The methodology presented herein facilitates identification and interpretation of high-throughput lipidomics data. In the context of the ob/ob mouse liver profiling, we have identified the parallel associations between the elevated triacylglycerol levels and the ceramides, as well as the putative activated ceramide-synthesis pathways.


Figures

Figure 1
Figure 1
Structures of major glycerophospholipids. R1, R2 and X are SMILES seed variables at sn-1, sn-2 and sn-3 positions respectively. Head groups legend: PA = Phosphate, PPA = Pyrophosphate, PE = Phosphoethanolamine, PC = Phosphocholine, PS = Phosphoserine, PG = Phosphoglycerol, and PI = Phosphoinositol.
Figure 2
Figure 2
Lipidomic platform data flow. Summary of our lipidomic platform data flow from raw peak data to interpretation of spectra involving MZmine based data processing, lipid identification, quantification and multivariate data analysis.
Figure 3
Figure 3
Lipid pathway instantiation. An illustrative example of instantiation of two co-regulated molecular species in the context of known lipid pathways. Upregulated species and enzymes (triangles) are in red, downregulated in green, unchanged in black.
Figure 4
Figure 4
Wild type and ob/ob mice liver cells. Liver tissue images of wild type (WT) and ob/ob mice.
Figure 5
Figure 5
Selected liver lipid profiles from the ob/ob mouse model. Array view of the lipid profiles. The changes are relative to the median intensity of individual molecular species within the Wild Type group. The p-values were calculated based on two-sided t-test, conservatively adjusted by a Bonfferoni correction for the total number of 192 identified lipids: *(p < 0.05), **(p < 0.01), ***(p < 0.001).
Figure 6
Figure 6
PLS/DA analysis of the ob/ob mouse model. (A) Score plot reveals genotype differences, as well as gender specific differences. (B) Loadings reveal major lipid classes associated with genotype differences.
Figure 7
Figure 7
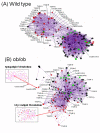
Correlation networks for ob/ob and WT mouse liver lipid profiles. Selected co-regulated cluster of lipid molecular species, including ceramides and acylglycerols. This network is based on Pearson correlation coefficient, r > 0.75 and statistic p-value < 0.001. Colored nodes in red (up regulation), green (down regulation) and black (no change) are based on 1.5-fold change cut off on mean value comparisons for ob/ob vs. WT mice. (A) Correlation network for WT mouse liver lipidomic data (B) Correlation network for ob/ob mouse liver lipidomic data.
Figure 8
Figure 8
Instantiated pathways for Cer(d18:1/18:0) and TG(18:1/18:1/18:1). Each node represents either lipid metabolite or enzyme or other interconnecting metabolism. Grey color represents metabolites/other metabolism and brown represents enzymes. Up and down regulation of corresponding nodes are denoted by red and green colors, respectively. Enzyme names are shown only if they are differentially regulated (~1.5 fold change). A) Instantiation of TG(18:1/18:1/18:1) as part of glycerolipid metabolism. (B) Instantiation of Cer(d18:1/18:0) as part of sphingolipid metabolism.

References

    1. Vance DE, Vance JE. In: Biochemistry of lipids, lipoproteins and membranes. 4th. Bernardi G, editor. Amsterdam, The Netherlands, Elsevier B. V.; 2004.
    1. Fahy E, Subramaniam S, Brown HA, Glass CK, Merrill AH, Jr., Murphy RC, Raetz CRH, Russell DW, Seyama Y, Shaw W, Shimizu T, Spener F, van Meer G, VanNieuwenhze MS, White SH, Witztum JL, Dennis EA. A comprehensive classification system for lipids. J Lipid Res. 2005;46:839–862. doi: 10.1194/jlr.E400004-JLR200. - DOI - PubMed
    1. Wenk MR. The emerging field of lipidomics. Nat Rev Drug Discov. 2005;4:594–610. doi: 10.1038/nrd1776. - DOI - PubMed
    1. van Meer G. Cellular lipidomics. EMBO J. 2005;24:3159–3165. doi: 10.1038/sj.emboj.7600798. - DOI - PMC - PubMed
    1. Watson AD. Thematic review series: systems biology approaches to metabolic and cardiovascular disorders. Lipidomics: a global approach to lipid analysis in biological systems. J Lipid Res. 2006;47:2101–2111. doi: 10.1194/jlr.R600022-JLR200. - DOI - PubMed

Publication types