. 2007 Feb 19:1:14.
doi: 10.1186/1752-0509-1-14.

Dynamics of in silico leukocyte rolling, activation, and adhesion

Affiliations

Dynamics of in silico leukocyte rolling, activation, and adhesion

Jonathan Tang et al. BMC Syst Biol. .

Abstract

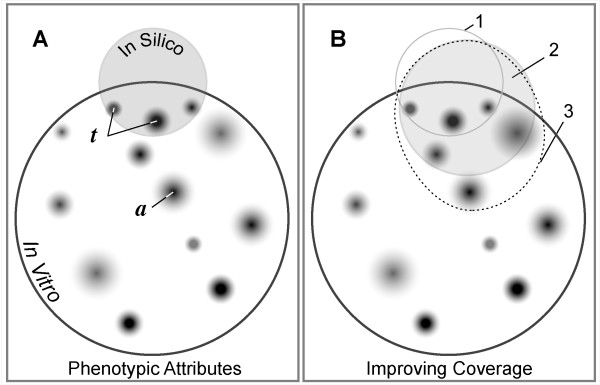
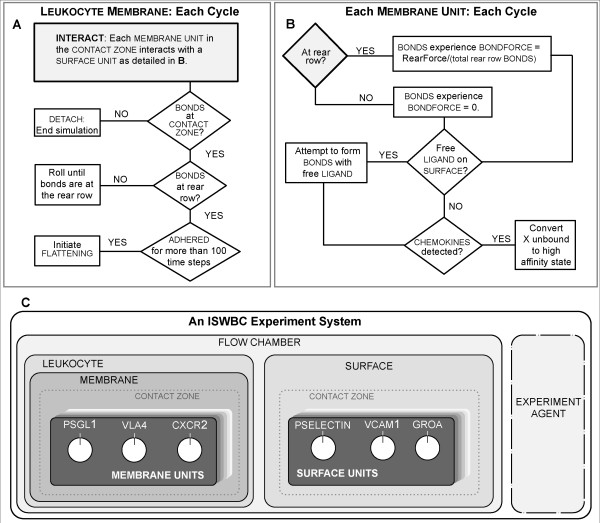
Background: We present a multilevel, agent based, in silico model that represents the dynamics of rolling, activation, and adhesion of individual leukocytes in vitro. Object-oriented software components were designed, verified, plugged together, and then operated in ways that represent the molecular and cellular mechanisms believed responsible for leukocyte rolling and adhesion. The result is an in silico analogue of an experimental in vitro system. The experimentally measured, phenotypic attributes of the analogue were compared and contrasted to those of leukocytes in vitro from three different experimental conditions.

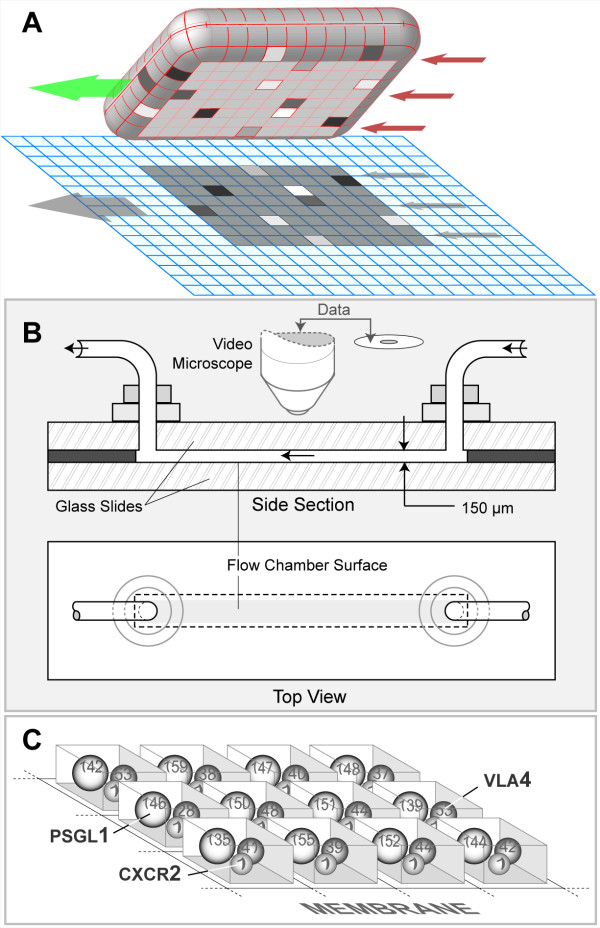
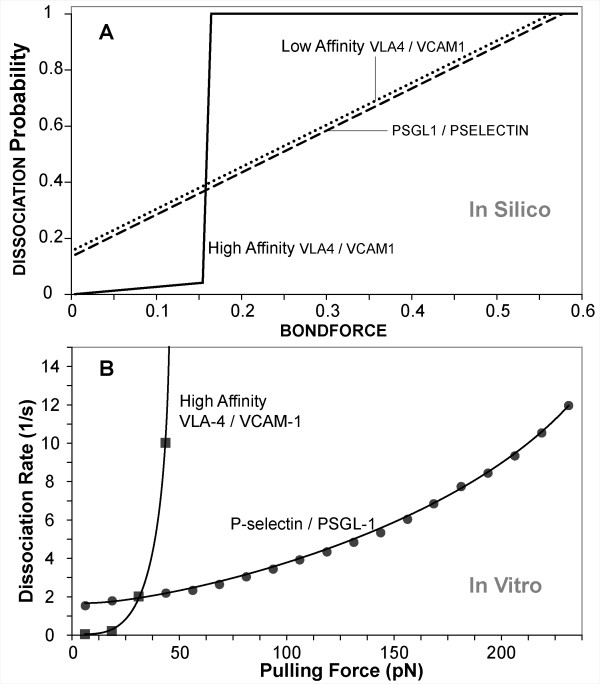
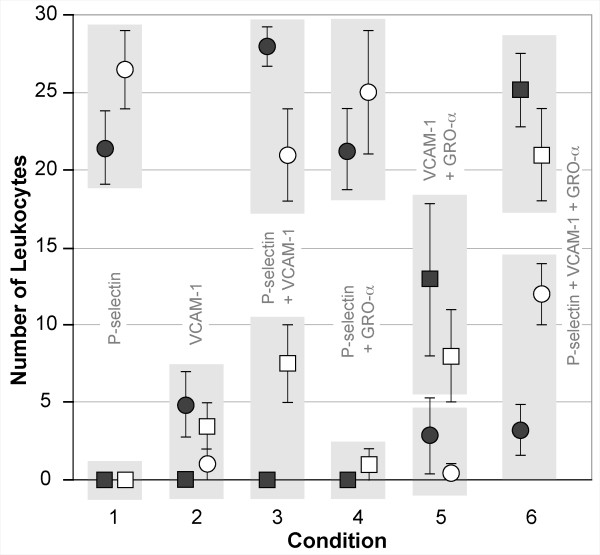
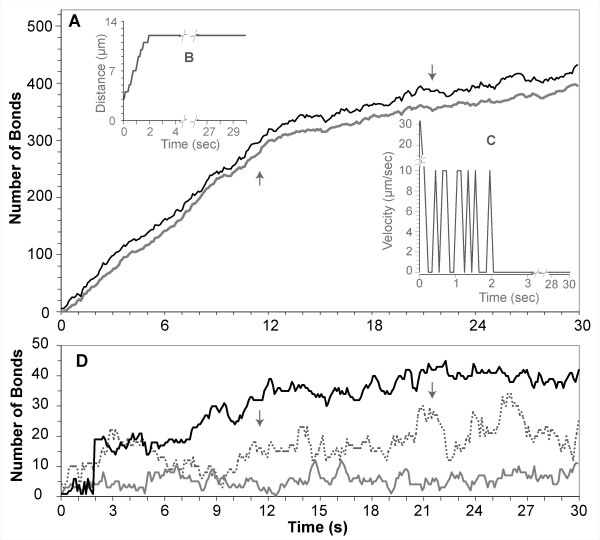
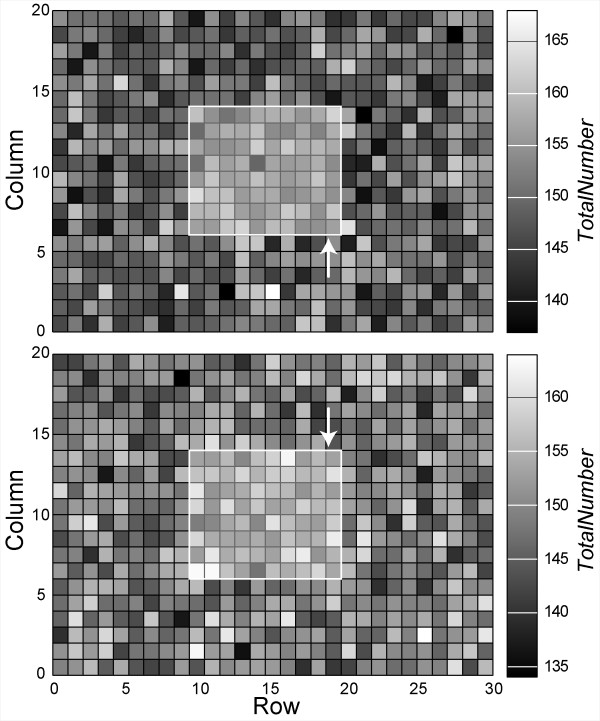
Results: The individual in silico dynamics of "rolling" on simulated P-selectin, and separately on simulated VCAM-1, were an acceptable match to individual in vitro distance-time and velocity-time measurements. The analogues are also able to represent the transition from rolling to adhesion on P-selectin and VCAM-1 in the presence of GRO-alpha chemokine. The individual in silico and in vitro behavioral similarities translated successfully to population level measures. These behavioral similarities were enabled in part by subdividing the functionality of the analogue's surface into 600 independent, "cell"-controlled, equally capable modules of comparable functionality.

Conclusion: The overlap in phenotypic attributes of our analogue with those of leukocytes in vitro confirm the considerable potential of our model for studying the key events that determine the behavioral outcome of individual leukocytes during rolling, activation, and adhesion. Our results provide an important foundation and framework for future in silico research into plausible causal links between well-documented, subcellular molecular level events and the variety of systemic phenotypic attributes that distinguish normal leukocyte adhesion from abnormal disease-associated adhesion.


Figures

Figure 1
Figure 1
An illustration of similarities of in silico and in vitro model systems. An abstract, Venn-like diagram depicts overlapping sets of similar features of in silico and in vitro models. The larger circle is a set of observable, measurable, phenotypic attributes of the experimental in vitro flow chamber system. Attention is focused on selected aspects of the system, e.g., leukocyte interactions with the flow chamber surface. (A) a: each small shaded domain represents experimental measures of a specific in vitro characteristic or property such as distance rolled. The degree of shading illustrates different levels of experimental and measurement uncertainty. t: these are members of the set of targeted in vitro attributes that the in silico model is expected mimic. The shaded circle contains the much smaller set of observable, measurable attributes of a foundational in silico analogue, such as the ISWBC. (B) The sketch illustrates the systematic, sequential extension of the foundational analogue's attributes to improve model-referent phenotype overlap. Circle #1: The set of attributes targeted by the ISWBC in A (the foundational analogue). Circle #2 (shaded): The targeted attributes (represented by circle #1) have been expanded to include two new attributes; however, ISWBC #1 fails to generate behaviors similar to the two newly targeted attributes, resulting in its invalidation. A copy of the ISWBC is iteratively refined (without losing or breaking the original behaviors) by adding new detail only as needed (or by replacing an atomic component with a composite component) until successful coverage of the expanded set of targeted attributes is achieved. Oval #3 (dotted): The analogue represented by circle #2 is to be improved: one new attribute is added to the set of targeted attributes in 2, and the process just described is repeated.
Figure 2
Figure 2
Sketches of in vitro and in silico experimental system components. (A) A LEUKOCYTE object is shown pulled away from the simulated flow chamber surface to which it was attached. The left arrow indicates ROLL direction; the three right arrows indicate SHEAR resulting from the simulated flow. The simulated flow chamber surface is discretized into independent units of function called SURFACE UNITS. The LEUKOCYTE'S MEMBRANE is similarly discretized into matching units of function called MEMBRANE UNITS: 600 total (20 × 30). The 8 × 10-shaded region on the SURFACE and on the underside of the LEUKOCYTE identifies the CONTACT ZONE. The UNITS within the CONTACT ZONES that are shaded differently indicate different numbers of BONDS had formed between LIGAND-LIGAND pairs in overlapping UNITS; otherwise, no BONDS formed. ROLLING is the result of a sequence of forward ratchet events. One ratchet event is the result of one row of MEMBRANE UNITS being released at the rear of the CONTACT ZONE along with engagement of a new row of at the front of the CONTACT ZONE. One ratchet event maps to a leukocyte rolling 1 μm (relative to the flow chamber surface). (B) A shop drawing of a typical parallel plate flow chamber used for in vitro studies of leukocyte rolling and adhesion. A video microscope is used to record leukocyte behaviors. (C) MEMBRANE UNITS are illustrated. Each MEMBRANE UNIT is simulated using a software object functioning as a container. In this sketch, nine MEMBRANE UNIT containers are shown. All leukocyte membrane functionality (relevant to these studies) within each UNIT is represented by three objects functioning as agents: PSGL1, VLA4 and CXCR2 (illustrated as spheres). The number of leukocyte ligands being represented by each is typically different from UNIT to UNIT, as illustrated by the numbers on the spheres. That number is specified for each simulation using parameter values from Table 3.
Figure 3
Figure 3
The decisional process for the LEUKOCYTE MEMBRANE and each MEMBRANE UNIT during a simulation cycle. (A) The LEUKOCYTE steps through its decisional process only once during a simulation cycle. At the start of the cycle, the MEMBRANE instructs all MEMBRANE UNITS within the CONTACT ZONE to follow the decisional process in B. Once that process is complete, the MEMBRANE completes its process by selecting and following the one applicable action option. (B) A MEMBRANE UNIT is described and illustrated in Figure 2. The state of each depends on the properties of the three LIGAND objects contained within. During each simulation cycle, each MEMBRANE UNIT, selected at random, uses this decisional process to update its status relative to the SURFACE UNIT over which it is positioned. (C) The hierarchical organization of the ISWBC system is illustrated. There are six levels. An Experiment Agent exists within the system, but separate from the FLOW CHAMBER and LEUKOCYTE. It represents a researcher conducting wet-lab experiments: it measures and records events and behaviors during each simulation.
Figure 4
Figure 4
FORCE dependence on BOND DISSOCIATION probability and force dependence on bond dissociation rates. (A) Shown is the relationship between bondforce and probability of BOND DISSOCIATION for each of the three LIGAND pairs within the CONTACT ZONE. The effects of shear on the ligand-ligand bonds that form at the rear of the leukocyte are simulated using bondforce. BONDS within the rear row of the CONTACT ZONE experience a bondforce that is calculated by dividing the RearForce, a unitless parameter representing the effects of shear, by the total number of BONDS within the rear row. During a simulation cycle, each MEMBRANE UNIT in the rear row uses the current value of bondforce and the graphed relationship to calculate a probability that each BOND will be broken during that cycle. All BONDS elsewhere within the CONTACT ZONE experience a bondforce value of 0. UNSTRESSED (bondforce value of 0) DISSOCIATION probabilities for PSGL1/PSELECTIN, LOW-AFFINITY VLA4/VCAM1, and HIGH-AFFINITY VLA4/VCAM1 were chosen to be 0.14, 0.16, and 0.0035, respectively. (B) The in vitro force dependence of dissociation rates for P-selectin/PSGL-1 bonds (as reported in [15]) and the high affinity VLA-4/VCAM-1 bonds (as reported in [29]) are plotted for comparison to the analogue relationships in A. The plotted values were taken from the fitted in vitro data: see Methods for details. The relationships in A are analogues of these experimentally determined relationships and are not meant to either match or fit that data. The dissociation rates of the PSGL-1/P-selectin bonds as a function of force were determined by experiments using PSGL-1-coated microbeads rolling on a P-selectin substrate in a parallel plate flow chamber [15]. The dissociation rates for the VLA-4/VCAM-1 complex, described in Methods, were calculated from data obtained using single-molecule dynamic force spectroscopy [29]. The force dependence of dissociation rates for low affinity VLA-4/VCAM-1 data was not reported. We assumed that it is similar to PSGL-1/P-selectin relationship in A.
Figure 5
Figure 5
Boxplot of measured PAUSE TIMES for LEUKOCYTES ROLLING on PSELECTIN at various RearForce values. At each RearForce value, average PAUSE TIME was recorded from 60 simulations that had at least 10 INTERACTIONS (pauses). In vitro, higher values of wall shear stress lead to shorter pause times. This data shows that higher RearForce values also lead to shorter LEUKOCYTE pause times. White circles: median pause time value. Box: lower and upper quartiles. Whiskers: minimum and maximum pause time values.
Figure 6
Figure 6
LEUKOCYTES ROLLING on PSELECTIN exhibit the characteristic jerky stop-and-go pattern of leukocyte rolling in vitro. (A) Examples are graphed for distance-time plots for a single ROLLING LEUKOCYTE studied in each of the indicated five RearForce conditions using the ENVIRONMENT parameter values in Table 5 (part I-A). (B) Solid line: values of a single leukocyte trajectory as reported in [16]. Open circles: an example LEUKOCYTE trajectory from simulations that used the ENVIRONMENT parameter values in Table 5 (part I-B).
Figure 7
Figure 7
Comparison of in silico and in vitro instantaneous velocity data. (A) Dotted trace: a leukocyte rolling on P-selectin in vitro as reported in [15]. Gray, shaded traces: two simulations of a LEUKOCYTE ROLLING on PSELECTIN using ENVIRONMENT parameter values from Table 5 (part I-C). Both traces show fluctuating rolling velocities similar to the dotted trace. (B) Distance-time plots from the experiments in A; solid line: in vitro leukocyte (calculated from the reported instantaneous velocity data); circles: the two in silico LEUKOCYTES from A.
Figure 8
Figure 8
Simulating experimental condition 2: rolling on VCAM-1 with shear increased at fixed intervals. Alon et al. [17] observed T-lymphocytes rolling on VCAM-1 in the absence of chemokine under increasing wall shear stress; wall shear stress was increased at fixed intervals causing increased leukocyte rolling velocities. Black line: a leukocyte trajectory reported in [17]. Gray line: an example LEUKOCYTE trajectory when using ENVIRONMENT parameter values from Table 5 (part II). Insert: in vitro measures of leukocyte velocity for different values of shear (upper axis); the standard deviations (vertical bars) were conservatively estimated using the standard errors reported in [17]. Circles: average ROLLING velocities of LEUKOCYTES (n = 60) for different RearForce values (lower axis) fall within the in vitro ranges. The original published distance-time plots begin at ~140 microns.
Figure 9
Figure 9
Comparison of in vitro and in silico results for six different experimental conditions. The in vitro conditions (from [3]): the flow chamber surface was coated with P-selectin and/or VCAM-1 with or without immobilized GRO-α chemokine. The number of leukocytes that rolled and adhered within each of five fields of view were recorded for a 30-second observation interval. In vitro: white circles: average number of leukocytes that rolled; white squares: average number of leukocytes that adhered; error bars: ± 1 SD. The data are clustered and plotted for each of six conditions, as labeled. By using the parameter values in Table 5 (part III), the in silico experiments mimicked the in vitro experimental conditions and also the results: the results are averages from 20 sets containing 30 LEUKOCYTES each; each simulation ran for 300 simulation cycles (equivalent to about 30 seconds). In silico: dark circles: average LEUKOCYTES that ROLLED; dark squares: average LEUKOCYTES that ADHERED; error bars: ± 1 SD. Each light gray box contains the two sets of observations (in vitro and in silico) that should be compared.
Figure 10
Figure 10
Measurements from a LEUKOCYTE that ROLLED and ADHERED to PSELECTIN and VCAM1 after activation by GROA CHEMOKINE. Smith et al. [3] observed that when the flow chamber surface is coated with P-selectin and VCAM-1 co-immobilized with GRO-α chemokines, monocyte arrest occurred within a few seconds. The data graphed is from an in silico experiment that simulated that protocol and is for an individual LEUKOCYTE that transitioned from ROLLING to FIRM ADHESION (Table 5, part III). (A) Dark line: total number of BONDS formed within the CONTACT ZONE between LEUKOCYTE MEMBRANE and SURFACE. Light gray line: number of high affinity VLA4-VCAM1 BONDS formed: these results show that ADHESION is mediated primarily by the high affinity VLA4-VCAM1 BONDS. (B) DISTANCE-TIME plot and (C) VELOCITY-TIME plot: they show that the LEUKOCYTE rolled for less than a few simulated seconds before firmly adhering to the SURFACE, consistent with leukocyte adhesions observed in vitro. (D) For the same experiment, the number of low affinity VLA4-VCAM1 BONDS and PSELECTIN-PSGL1 BONDS are small and so are plotted here at a smaller scale. Dotted trace: number of low affinity VLA4-VCAM1 BONDS. Lower solid gray trace: number of BONDS formed between PSELECTIN and PSGL1. The black trace is a separate plot of the total number of BONDS formed at each time in the rear row of this CONTACT ZONE; these data show that for the ISWBC, the LOW AFFINITY VLA4/VCAM1 AND PSELECTIN/PSGL1 BONDS play only a minor role in supporting ADHESION. Arrows indicate when a LEUKOCYTE MEMBRANE SPREADING event occurred.
Figure 11
Figure 11
Contour plots show the number of PSGL-1 molecules represented by a MEMBRANE UNIT. The number of PSGL-1 represented are shown for two different LEUKOCYTE MEMBRANES. Each of the 600 MEMBRANE UNITS within each MEMBRANE contains one PSGL1 agent (see Figure 2C). Each PSGL1 TotalNumber parameter value (indicated by the scale on the right) specifies the number of PSGL-1 molecules represented in a specified MEMBRANE UNIT. When averaged over the entire MEMBRANE, a typical PSGL1 represents 150 ± 5 PSGL-1 (see Table 3). The 8 × 10 region outlined in white is the CONTACT ZONE. Arrows specify the row of MEMBRANE UNITS (at the "rear" of the CONTACT ZONE) that experiences RearForce, when the LEUKOCYTE is moving from right to left.

References

    1. Ulbrich H, Eriksson EE, Lindbom L. Leukocyte and endothelial cell adhesion molecules as targets for therapeutic interventions in inflammatory disease. Trends Pharmacol Sci. 2003;24:640–647. doi: 10.1016/j.tips.2003.10.004. - DOI - PubMed
    1. Zhu C, Bao G, Wang N. Cell mechanics: mechanical response, cell adhesion, and molecular deformation. Annu Rev Biomed Eng. 2000;2:189–226. doi: 10.1146/annurev.bioeng.2.1.189. - DOI - PubMed
    1. Smith DF, Galkina E, Ley K, Huo Y. GRO family chemokines are specialized for monocyte arrest from flow. Am J Physiol Heart Circ Physiol. 2005;289:H1976–1984. doi: 10.1152/ajpheart.00153.2005. - DOI - PubMed
    1. Simon SI, Green CE. Molecular mechanics and dynamics of leukocyte recruitment during inflammation. Annu Rev Biomed Eng. 2005;7:151–185. doi: 10.1146/annurev.bioeng.7.060804.100423. - DOI - PubMed
    1. Hamann A, Engelhardt B. Leukocyte trafficking: molecular mechanisms, therapeutic targets, and methods. Weinheim: Wiley-VCH Verlag GmbH & Co. KGaA; 2005.

Publication types