. 2007 Jan 8:1:2.
doi: 10.1186/1752-0509-1-2.

Structural and functional analysis of cellular networks with CellNetAnalyzer

Affiliations

Structural and functional analysis of cellular networks with CellNetAnalyzer

Steffen Klamt et al. BMC Syst Biol. .

Abstract

Background: Mathematical modelling of cellular networks is an integral part of Systems Biology and requires appropriate software tools. An important class of methods in Systems Biology deals with structural or topological (parameter-free) analysis of cellular networks. So far, software tools providing such methods for both mass-flow (metabolic) as well as signal-flow (signalling and regulatory) networks are lacking.

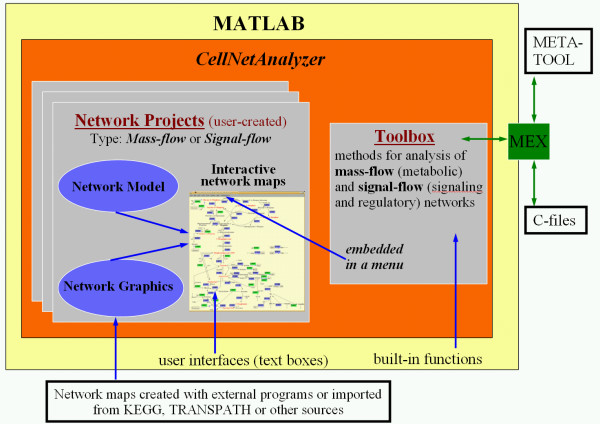
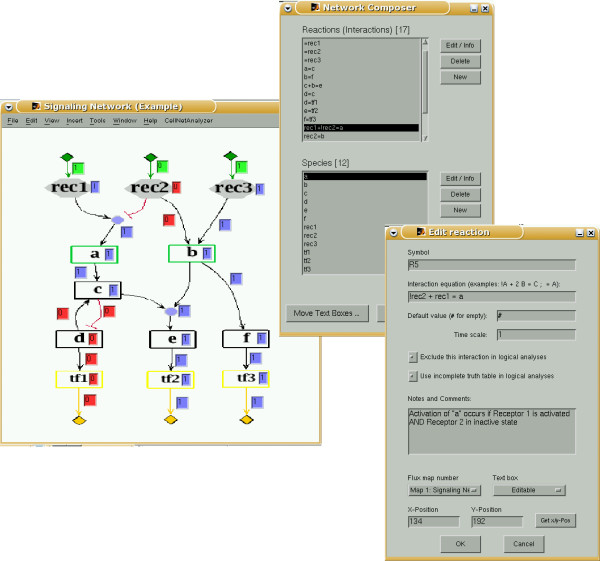
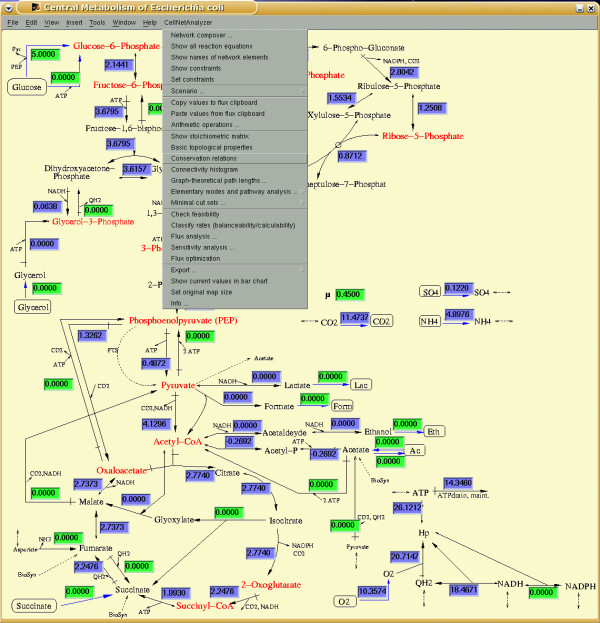
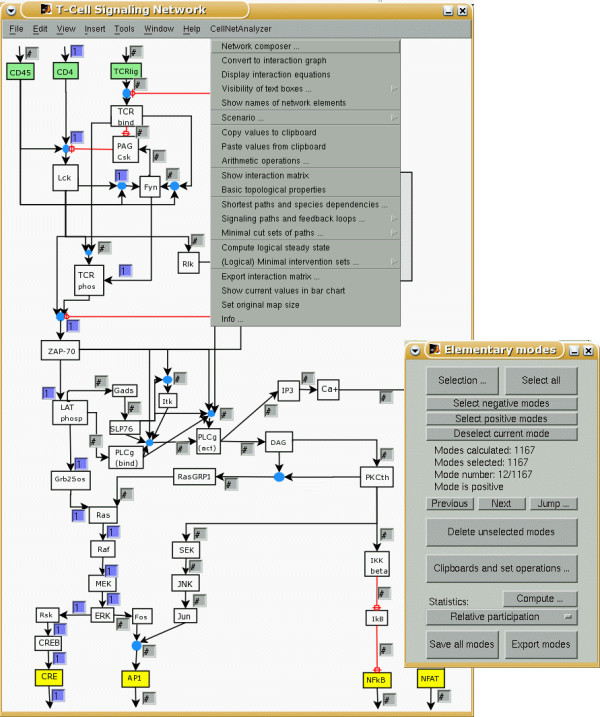
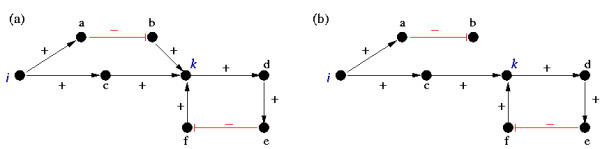
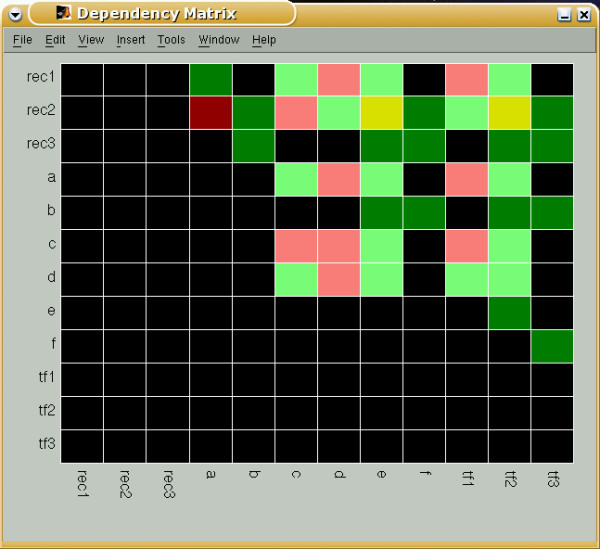
Results: Herein we introduce CellNetAnalyzer, a toolbox for MATLAB facilitating, in an interactive and visual manner, a comprehensive structural analysis of metabolic, signalling and regulatory networks. The particular strengths of CellNetAnalyzer are methods for functional network analysis, i.e. for characterising functional states, for detecting functional dependencies, for identifying intervention strategies, or for giving qualitative predictions on the effects of perturbations. CellNetAnalyzer extends its predecessor FluxAnalyzer (originally developed for metabolic network and pathway analysis) by a new modelling framework for examining signal-flow networks. Two of the novel methods implemented in CellNetAnalyzer are discussed in more detail regarding algorithmic issues and applications: the computation and analysis (i) of shortest positive and shortest negative paths and circuits in interaction graphs and (ii) of minimal intervention sets in logical networks.

Conclusion: CellNetAnalyzer provides a single suite to perform structural and qualitative analysis of both mass-flow- and signal-flow-based cellular networks in a user-friendly environment. It provides a large toolbox with various, partially unique, functions and algorithms for functional network analysis. CellNetAnalyzer is freely available for academic use.


Figures

Figure 1
Figure 1
General set-up of CellNetAnalyzer. For explanations see main text.
Figure 2
Figure 2
Example of an interactive network map of a simple signalling network. (Map and model were created with ProMoT [11] and exported to CellNetAnalyzer.) Note that the red edges represent inhibition (NOT operation) and blue circles indicate logical ANDs (compare also with Table 1). In the presented scenario, receptors rec1 and rec3 are activated by external signals, whereas receptor rec2 is not. The text boxes along the (hyper)arcs display signal flows (green boxes: fixed signal prior computation; blue boxes: signal flow activating a species (signal flow is one); red boxes: no activating signal is flowing along this connection). The text boxes attached to the species represent the states of the nodes in the resulting logical steady state. Network composer and the mask for editing reactions/interactions are also shown.
Figure 3
Figure 3
Example of an interactive network map of a mass-flow (metabolic) network in CellNetAnalyzer. The network shows the central metabolism of E. coli studied in [9]. The text boxes display a computed steady-state flux distribution (the numbers represent reaction rates). Green boxes indicate rates fixed prior computation and blue boxes show calculated rates. The pull-down menu of CellNetAnalyzer (for mass-flow networks) is also shown.
Figure 4
Figure 4
Example of an interactive network map in CellNetAnalyzer, here from a signal-flow network related to signalling pathways in T-cells. The blue text boxes display a signalling path from the receptor CD4 to the transcription factor CRE. The menu of CellNetAnalyzer (here for signal-flow networks) and the control panel for elementary modes/signalling paths are also shown.
Figure 5
Figure 5
Two examples of simple signed directed graphs (interaction graphs). Graph (b) is the same as graph (a) except that the negative arc from b to k has been removed.
Figure 6
Figure 6
Dependency matrix of the network in Figure 2 as displayed by CellNetAnalyzer. The color of a matrix element Mxy has the following meaning (see [8] and text): (i) dark green: x is a strong (total) activator of y; (ii) light green: x is a weak (non-total) activator of y; (iii) dark red: x is a strong (total) inhibitor of y; (iv) light red: x is a weak (non-total) inhibitor of y; (v) yellow: x is an ambivalent factor for y; (vi) black: x does not influence y.

References

    1. Alon U, Surette MG, Barkai N, Leibler S. Robustness in bacterial chemotaxis. Nature. 1999;397:168–171. doi: 10.1038/16483. - DOI - PubMed
    1. Wiley HS, Shvartsman SY, Lauffenburger DA. Computational modeling of the EGF-receptor system: a paradigm for systems biology. Trends Cell Biol. 2003;13:43–50. doi: 10.1016/S0962-8924(02)00009-0. - DOI - PubMed
    1. Bornholdt S. Systems Biology: Less is more in modelling large genetic networks. Science. 2005;310:449–451. doi: 10.1126/science.1119959. - DOI - PubMed
    1. Price ND, Reed JL, Palsson BO. Genome-scale models of microbial cells: evaluating the consequences of constraints. Nat Rev Microbiol. 2004;2:886–897. doi: 10.1038/nrmicro1023. - DOI - PubMed
    1. Klamt S, Stelling J. Stoichiometric and constraint-based modeling. In: Szallasi Z, Periwal V, Stelling J, editor. System Modeling in Cellular Biology: From Concepts to Nuts and Bolts. Cambridge, MIT Press; 2006. pp. 73–96.

Publication types