. 2007 Jan 26:1:8.
doi: 10.1186/1752-0509-1-8.

Identification of functional modules using network topology and high-throughput data

Affiliations

Identification of functional modules using network topology and high-throughput data

Igor Ulitsky et al. BMC Syst Biol. .

Abstract

Background: With the advent of systems biology, biological knowledge is often represented today by networks. These include regulatory and metabolic networks, protein-protein interaction networks, and many others. At the same time, high-throughput genomics and proteomics techniques generate very large data sets, which require sophisticated computational analysis. Usually, separate and different analysis methodologies are applied to each of the two data types. An integrated investigation of network and high-throughput information together can improve the quality of the analysis by accounting simultaneously for topological network properties alongside intrinsic features of the high-throughput data.

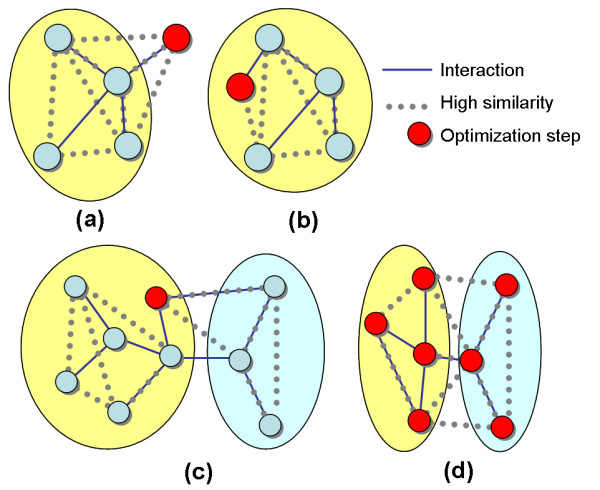
Results: We describe a novel algorithmic framework for this challenge. We first transform the high-throughput data into similarity values, (e.g., by computing pairwise similarity of gene expression patterns from microarray data). Then, given a network of genes or proteins and similarity values between some of them, we seek connected sub-networks (or modules) that manifest high similarity. We develop algorithms for this problem and evaluate their performance on the osmotic shock response network in S. cerevisiae and on the human cell cycle network. We demonstrate that focused, biologically meaningful and relevant functional modules are obtained. In comparison with extant algorithms, our approach has higher sensitivity and higher specificity.

Conclusion: We have demonstrated that our method can accurately identify functional modules. Hence, it carries the promise to be highly useful in analysis of high throughput data.


Figures

Figure 1
Figure 1
Toy input example. A toy example of an input problem with two distinct JACSs and with front and back nodes. Both JACSs (circled) are connected in the interaction network and heavy in the similarity graph. Note that the four front nodes in the left JACS form a connected subgraph only after the addition of the back node.
Figure 2
Figure 2
Performance of different module finding procedures on simulated data. Co-clustering: clustering based on the distance metric of [17]. K-Means: clustering of the similarity data. Random: random sampling of connected subnetworks matched in size and number to the planted components. The quality of solutions produced by the different procedures is evaluated by the Jaccard coefficient, (a) Performance as a function of the distance between the means of the mates and the non-mates distributions (μm). (b) Performance as a function of the fraction of front nodes (pf). (c) Performance as a function of planted component size (k).
Figure 3
Figure 3
Performance of different module finding algorithmson S. cerevisiae osmotic shock data. (a) The fraction of the modules for which at least one category was enriched, (b) The fraction of the categories enriched in at least one module. Enrichment was defined as attaining hypergeometric p-value ≤ 10-3. Annotation sets: GO-Process: Level 7 of the GO "biological process" ontology; GO-Complex: subterms of "protein complex" term, GO:0043234; MIPS Phenotypes: MIPS deletion phenotype annotations; KEGG Pathways: KEGG molecular pathway participation.
Figure 4
Figure 4
Two of the JACSs identified in the S. cerevisiae analysis. (a) The pheromone response subnetwork, (b) The proteolysis subnetwork. The front nodes are the yellow (light gray) rectangles and the back nodes and the blue (dark gray) ovals. The genes annotated with pheromone response (a) and proteolysis (b) are drawn with thicker border. Gene lists, expression matrices and interactive display of all the subnetworks are available at the supplementary website.
Figure 5
Figure 5
Examples of the MATISSE analysis in the cell cycle data of human HeLa cells. Front nodes and back nodes are as indicated in Figure 4. (a) The highest scoring cell-cycle related JACS identified. The genes annotated with "cell cycle" are drawn with thicker border. Gene lists, expression matrices and interactive display of all the subnetworks are available at the supplementary website, (b) Subnetwork hubs. The figure shows 36 nodes in the JACSs that were identified as subnetwork hubs and induced a connected component in the network. 16 additional hubs that had no interactions with other hubs are not shown. The known master regulators p53, ATM, E2F1, TGFβR, CDK4 and CDC42 are circled.
Figure 6
Figure 6
Toy examples of the moves performed by the optimization algorithm. (a) Node addition; (b) Node removal; (c) Assignment change; (d) JACS merge. In each case the affected nodes are in red (black).
Figure 7
Figure 7
Dependence of the running time on the size of the JACS. The running time of MATISSE with different maximum JACS size parameters. The execution did not include the weight calculation step, as it is not dependent on the JACS size.
Figure 8
Figure 8
Performance of the three proposed heuristics on simulated data. See Figure 2 for further details.
Figure 9
Figure 9
Performance of the three proposed heuristic in terms of annotation enrichment. See Figure 3 for further details.

References

    1. Lord P, Stevens R, Brass A, Goble C. Investigating semantic similarity measures across the Gene Ontology: the relationship between sequence and annotation. Bioinformatics. 2003;19:1275–83. - PubMed
    1. Kim R, Ji J, Wong W. An improved distance measure between the expression profiles linking co-expression and co-regulation in mouse. BMC Bioinformatics. 2006;7:44. - PMC - PubMed
    1. Ge H, Liu Z, Church G, Vidal M. Correlation between transcriptome and interactome mapping data from Saccharomyces cerevisiae. Nat Genet. 2001;29:482–486. - PubMed
    1. Hahn A, Rahnenführer J, Talwar P, Lengauer T. Confirmation of human protein interaction data by human expression data. BMC Bioinformatics. 2005;6:112. - PMC - PubMed
    1. Jansen R, Yu H, Greenbaum D, Kluger Y, Krogan NJ, Chung S, Emili A, Snyder M, Greenblatt JF, Gerstein M. A Bayesian networks approach for predicting protein-protein interactions from genomic data. Science. 2003;302 - PubMed

Publication types

LinkOut - more resources