. 2007 Apr 5;54(1):137-52.
doi: 10.1016/j.neuron.2007.02.029.

The emergence of contrast-invariant orientation tuning in simple cells of cat visual cortex

Affiliations

The emergence of contrast-invariant orientation tuning in simple cells of cat visual cortex

Ian M Finn et al. Neuron. .

Abstract

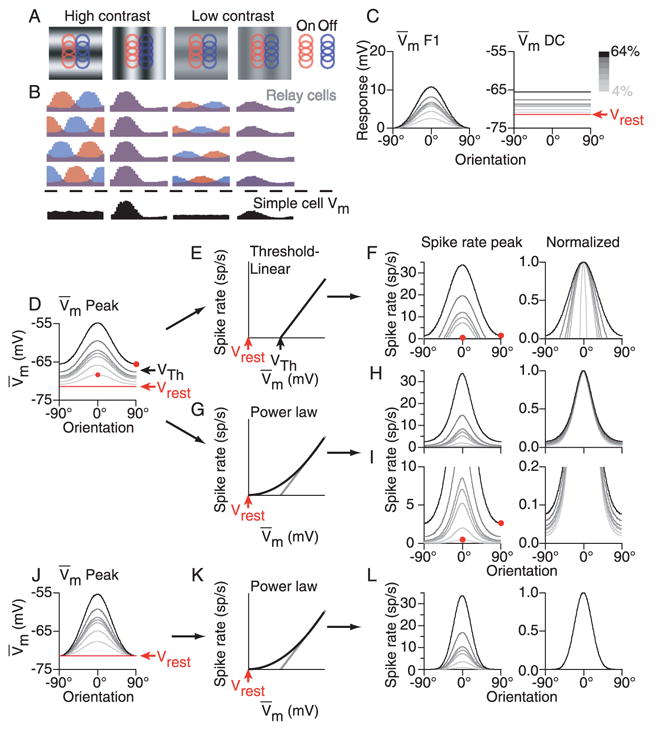
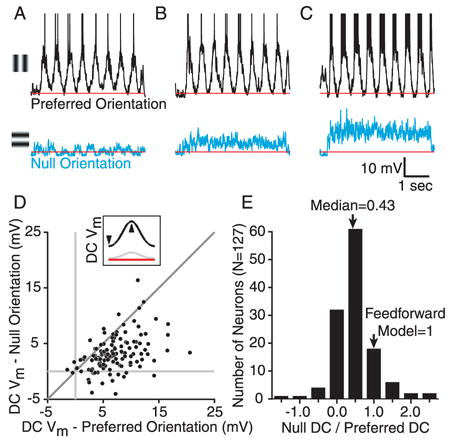
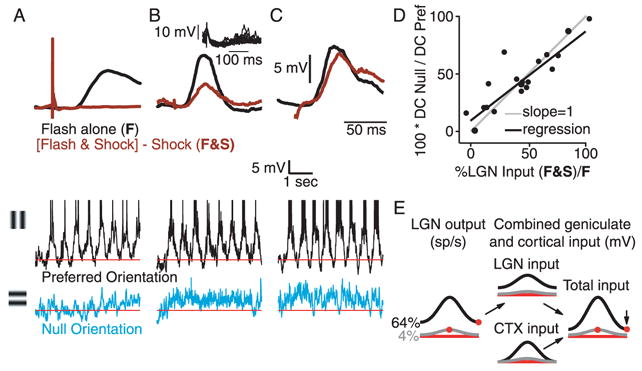
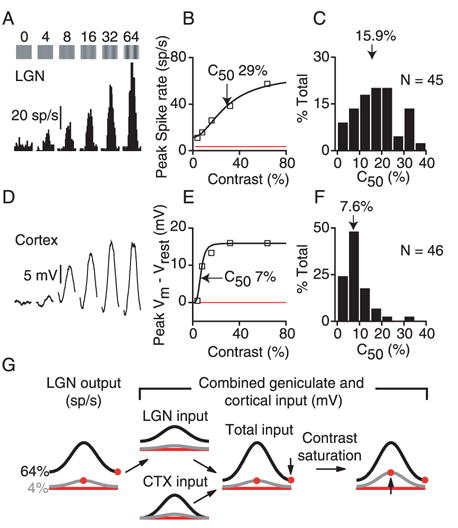
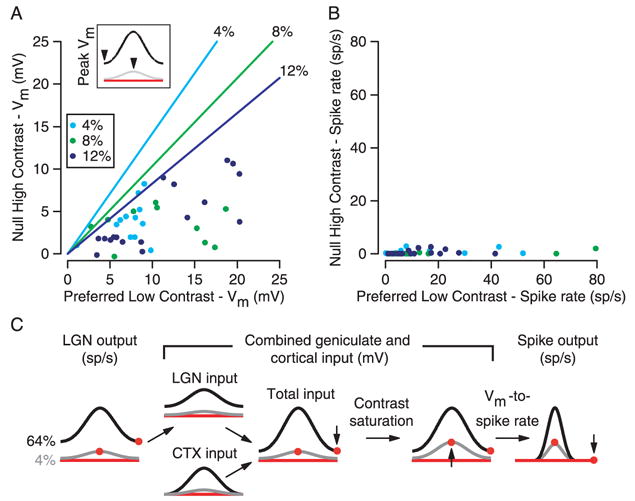
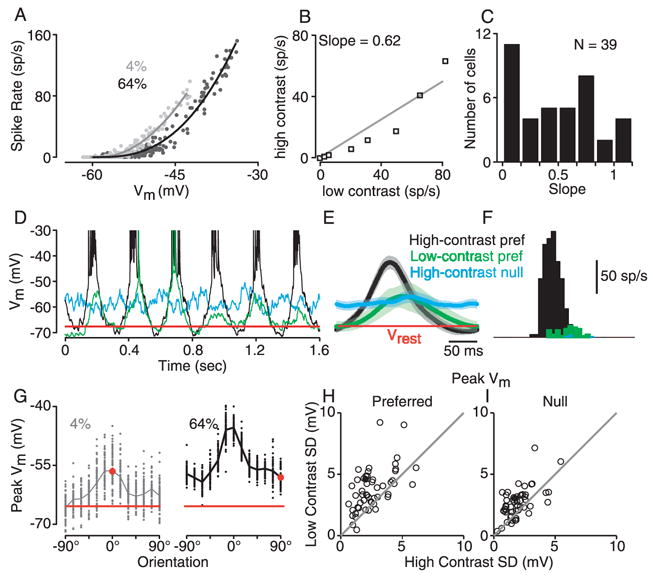
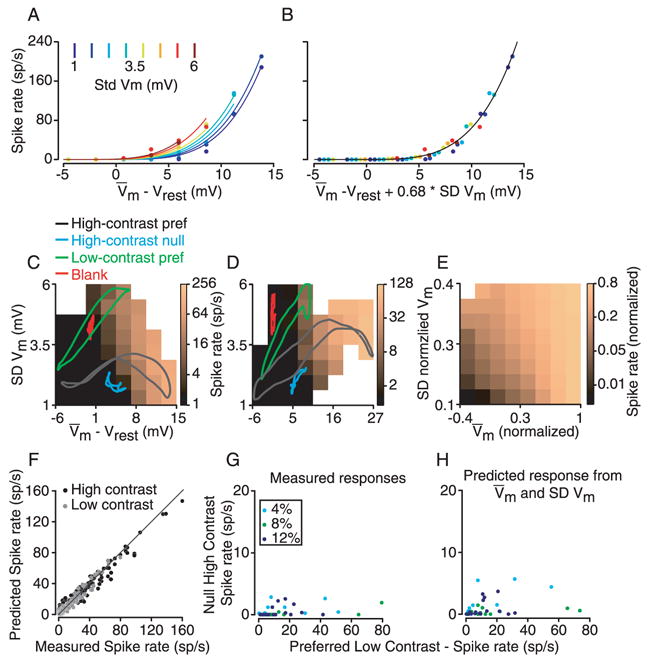
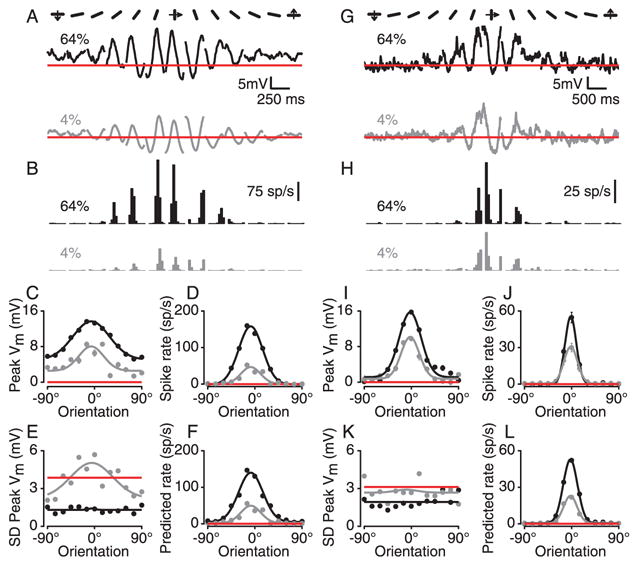
Simple cells in primary visual cortex exhibit contrast-invariant orientation tuning, in seeming contradiction to feed-forward models that rely on lateral geniculate nucleus (LGN) input alone. Contrast invariance has therefore been thought to depend on the presence of intracortical lateral inhibition. In vivo intracellular recordings instead suggest that contrast invariance can be explained by three properties of the excitatory pathway. (1) Depolarizations evoked by orthogonal stimuli are determined by the amount of excitation a cell receives from the LGN, relative to the excitation it receives from other cortical cells. (2) Depolarizations evoked by preferred stimuli saturate at lower contrasts than the spike output of LGN relay cells. (3) Visual stimuli evoke contrast-dependent changes in trial-to-trial variability, which lead to contrast-dependent changes in the relationship between membrane potential and spike rate. Thus, high-contrast, orthogonally oriented stimuli that evoke significant depolarizations evoke few spikes. Together these mechanisms, without lateral inhibition, can account for contrast-invariant stimulus selectivity.


Figures

Figure 1
Figure 1
Contrast dependence of orientation tuning in a feed-forward model of simple cells. A. Receptive fields and responses (colored traces) for 8 of the 16 relay-cell inputs to the model simple cell. B. Responses to both preferred and null-oriented gratings at high and low contrast are shown, as is the total input (black traces). C. Orientation tuning curves for the F1 and DC components of the synaptic input to the simple cell. D. Orientation tuning curve of the peak input to the simple cell (F1+DC). E. A threshold-linear transformation between membrane potential and spike rate. F. Orientation tuning curves (raw values and normalized) for peak spike rate as predicted by the threshold-linear transformation. G. A power-law transformation between membrane potential and spike rate. H. Same as E for the power-law transformation. I. Same as G with amplified vertical scale. J–L. Same as C, F and G with the DC component of the membrane potential response removed.
Figure 2
Figure 2
Responses of simple cells to gratings of the preferred and orthogonal orientation. A–C. 8 cycles of response to a high-contrast drifting grating at the preferred (above) and orthogonal or null orientation (below) for three cells. Grating onset occurred after 250ms of blank stimulation. D. The DC components of the responses to high-contrast gratings of the preferred and null orientation plotted against one another for 127 cells. E. A histogram of ratios for the values in D.
Figure 3
Figure 3
The relationship between the response to null-oriented stimuli and the amount of input from the LGN. A–C. Top, responses to optimal flashed gratings with (brown) and without (black) paired electrical stimulation of nearby cortex for 3 cells. The response to electrical stimulation alone has been subtracted from the brown traces. The ratio of the amplitudes of the brown and black traces (F&S/F) is taken to be the proportion of synaptic input the cell receives directly from the LGN. The cell in A receives almost no direct input from the LGN; the cell in C receives almost exclusive input from the LGN. Middle and bottom, responses to high-contrast drifting gratings of the preferred and null orientation for the 3 cells. Inset in B shows 20 superimposed responses to electrical stimulation alone. D. The ratio of responses to null and preferred stimuli (DC component) plotted against the proportion of input provided by the LGN (N=19). E. Left, orientation tuning curves for the combined output from the relay cells exciting the model simple cell that receives input only from the LGN. Right, orientation tuning curves for a cell that receives half it’s input from the LGN and half from other cortical cells with similar preferred orientation. The main effect is to reduce the response of the cell to stimuli of the null orientation.
Figure 4
Figure 4
Contrast saturation in LGN and cortex. A. Spike responses of a geniculate relay cell to drifting gratings of different contrast. B. Contrast response curve constructed from the peak (F1+DC) responses in A. C. A histogram of C50’s for 45 relay cells. D–F. Same as A–C for the peak membrane potential responses of 46 cortical simple cells. G. Same as Fig. 3E, but with the addition of early contrast saturation. The effect of early saturation is to raise the amplitude of responses to low-contrast stimuli of the preferred orientation.
Figure 5
Figure 5
Lack of spiking responses to high-contrast stimuli of the null orientation. A and B. The response (A - membrane potential; B - spike rate) to high-contrast stimuli of the null orientation plotted against the response to low-contrast stimuli of the preferred orientation. Symbols of different shades of gray indicate the contrast of the low-contrast stimulus. Lines indicate the predictions of the feed-forward model in Fig. 1. C. Same Figs. as 3E and 4G, with the addition of the Vm-to-spike-rate transformation, which differentially amplifies the responses to high-contrast preferred and low-contrast null stimuli while narrowing the tuning curves equally.
Figure 6
Figure 6
The contrast dependence of trial-to-trial variability and its effect on mean spike rate. A. The relationship between mean spike rate and mean membrane potential plotted separately for low-contrast and high-contrast stimuli in one simple cell. Each point is derived from one 30-ms epoch of a trial-averaged response (13 stimuli, 16 epochs each). Solid curves are power-law fits (Equation 1) to the data. B. Average spike rate at high contrast plotted against spike rate at low contrast for each of 8 ranges of mean membrane potential in A. Solid line is a linear regression. C. Slope of the regression (as in B) for 39 cells. D. Six cycles of the responses of a simple cell to high- and low-contrast gratings of the preferred orientation (black and blue) and to a low-contrast grating of the null orientation (green). E. Cycle-averages of the responses to the three stimuli, with standard deviation indicated by shading. The mean and standard deviation of the membrane potential were computed using a 30 ms sliding window. F. Average spike responses for the three stimuli. G. Orientation tuning curves for the peak (F1+DC) response of the cell at high and low contrast. Each point represents the peak response to a single cycle. H. The trial-to-trial standard deviation of peak response amplitudes for low-contrast gratings plotted against the standard deviation for high-contrast gratings at the preferred and null orientations (52 cells).
Figure 7
Figure 7
The relationship between membrane potential mean, standard deviation, and spike rate. A. Mean and standard deviation of membrane potential and mean spike rate were measured in 30-ms epochs taken from the responses to gratings of different orientations and contrast. Data were binned into 2.25-mV intervals of mean potential and 0.625-mV intervals of standard deviation (SD) and then mean spike rate was plotted against mean membrane potential for 8 different SD intervals as indicated by the color legend. Curves are a fit to Equation 2. B. Same data as in A, with spike rate plotted against mean membrane potential plus 0.68 times SD. C. Same data as in A and B plotted as a color-map of spike rate against mean and standard deviation of membrane potential. Colored lines indicate the trajectory of mean and SD of membrane potential evoked by 4 different stimuli over the course of one grating cycle (high-contrast preferred, black; high-contrast null, blue; low-contrast preferred, green; blank, red). The mean and standard deviation of the membrane potential were computed using a 30 ms sliding window. D. Same as C for the cell from Fig. 6D–G. E. Same as C and D averaged over 39 cells. Vm and SD-Vm are normalized for each cell to the amplitude of the largest membrane potential response. F. For 39 cells, the spike responses to stimuli of all orientations at high and low contrasts were calculated from Equation 2 using the corresponding membrane potential responses. The predicted spike rates are plotted against measured spike rates for each stimulus. G. Data from Fig. 5B (spike-rate responses to high-contrast null and low-contrast preferred stimuli plotted against one another) replotted with a magnified y-scale. H. Same as G, except that the spike rates plotted are predicted from membrane potential using Equation 2.
Figure 8
Figure 8
Contrast invariance of orientation tuning in two simple cells. A. Cycle-averaged membrane potential responses to gratings of high and low contrast and different orientations. B. Corresponding spike responses. C–G. Orientation tuning curves at high and low contrast for mean membrane potential, spike rate, standard deviation of membrane potential and predicted spike rate (from Equation 2). GM. Same as A–F for a second cell.
Figure 9
Figure 9
Contrast dependence of orientation tuning width. AC. Half-width at half height (HWHH) of the orientation tuning curves at high and low contrast compared for mean membrane potential, measured spike rate, and spike rate predicted from Equation 2. D–F. Histograms of low-contrast HWHH minus high-contrast HWHH.

Comment in

References

    1. Abbott LF, Varela JA, Sen K, Nelson SB. Synaptic depression and cortical gain control. Science. 1997;275:220–224. - PubMed
    1. Alitto HJ, Usrey WM. Influence of contrast on orientation and temporal frequency tuning in ferret primary visual cortex. J Neurophysiol. 2004;91:2797–2808. - PubMed
    1. Anderson J, Lampl I, Reichova I, Carandini M, Ferster D. Stimulus dependence of two-state fluctuations of membrane potential in cat visual cortex. Nat Neurosci. 2000a;3:617–621. - PubMed
    1. Anderson JS, Carandini M, Ferster D. Orientation tuning of input conductance, excitation, and inhibition in cat primary visual cortex. J Neurophysiol. 2000b;84:909–926. - PubMed
    1. Anderson JS, Lampl L, Gillespie D, Ferster D. The contribution of noise to contrast invariance of orientation tuning in cat visual cortex. Science. 2000c;290:1968–1971. - PubMed

Publication types

LinkOut - more resources