. 2007 Jun;176(2):1035-47.
doi: 10.1534/genetics.106.068874. Epub 2007 Apr 3.

An exact nonparametric method for inferring mosaic structure in sequence triplets

Affiliations

An exact nonparametric method for inferring mosaic structure in sequence triplets

Maciej F Boni et al. Genetics. 2007 Jun.

Abstract

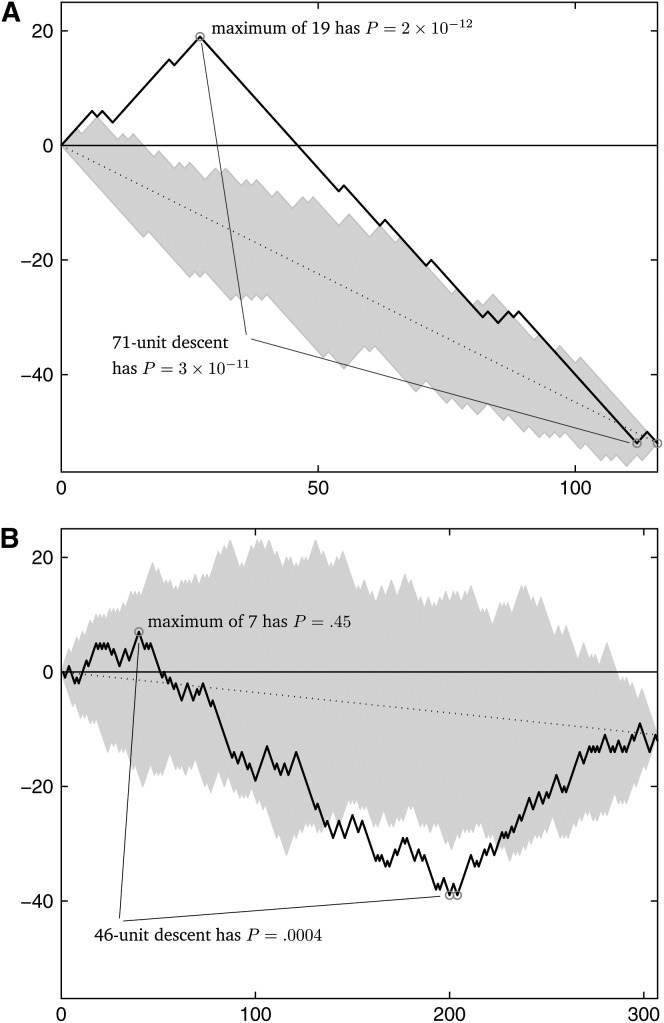
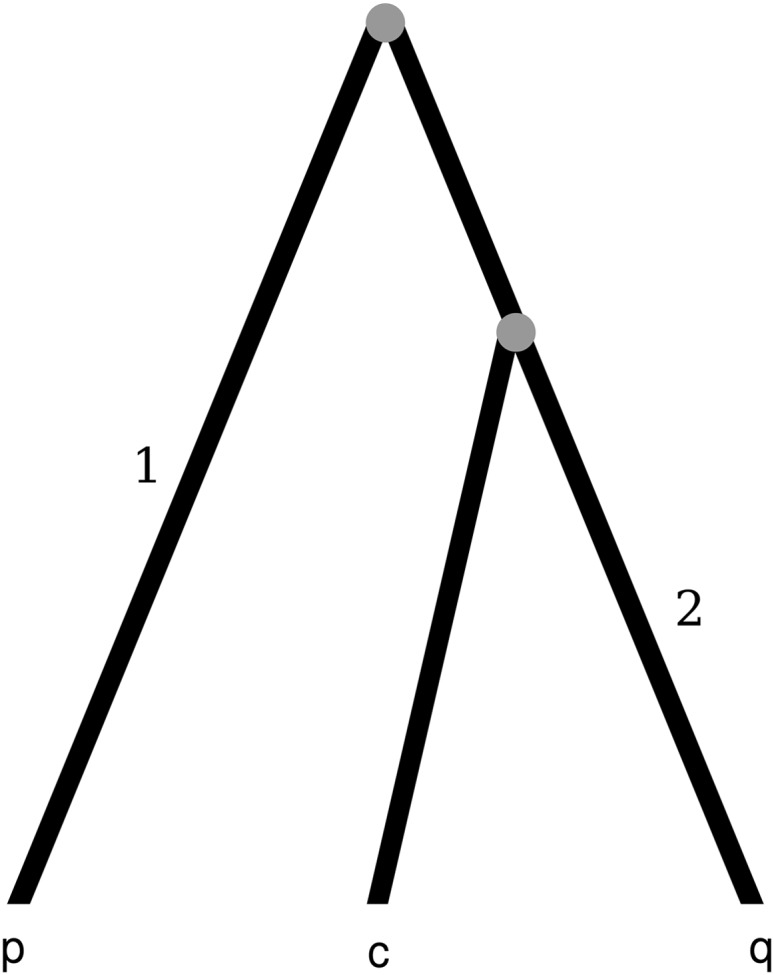
Statistical tests for detecting mosaic structure or recombination among nucleotide sequences usually rely on identifying a pattern or a signal that would be unlikely to appear under clonal reproduction. Dozens of such tests have been described, but many are hampered by long running times, confounding of selection and recombination, and/or inability to isolate the mosaic-producing event. We introduce a test that is exact, nonparametric, rapidly computable, free of the infinite-sites assumption, able to distinguish between recombination and variation in mutation/fixation rates, and able to identify the breakpoints and sequences involved in the mosaic-producing event. Our test considers three sequences at a time: two parent sequences that may have recombined, with one or two breakpoints, to form the third sequence (the child sequence). Excess similarity of the child sequence to a candidate recombinant of the parents is a sign of recombination; we take the maximum value of this excess similarity as our test statistic Delta(m,n,b). We present a method for rapidly calculating the distribution of Delta(m,n,b) and demonstrate that it has comparable power to and a much improved running time over previous methods, especially in detecting recombination in large data sets.


Figures

F<sc>igure</sc> 1.—
Figure 1.—
Observed walks diagrammed from the informative sites of sequence triples. (A) The walk is diagrammed from Neisseria data (from the fourth row of Table 1). (B) The walk is diagrammed from influenza data (from the first row of Table 2). The circles indicate the beginning and end of the maximum descent in each walk, and in both cases the beginning of the maximum descent is also the maximum height of the walk. The dotted line in each diagram denotes the expected location of the hypergeometric random walk. The shaded areas in each diagram show the range of 100 simulated HGRWs.
F<sc>igure</sc> 2.—
Figure 2.—
Power and false-positive comparisons to the 14 methods tested in Posada and Crandall (2001). The top four graphs include two additional LPT methods described in Carvajal-Rodríguez et al. (2006). The graphs in the left column plot power under different recombination rates, while the right-hand column shows false-positive rates when there is variation in mutation rates but recombination is not present; α = ∞ means that there is no rate variation, while lower values of α indicate higher rate variation. The red line shows the power and false-positive rate of Δm,n,2 in detecting recombination. The gray lines show the power and false-positive rates of 14 (or 16) other methods. α = ∞ in the left column; ρ = 0 in the right column.
F<sc>igure</sc> 3.—
Figure 3.—
Power and false-positive comparisons with MR and Chimaera on sequence triplets. The red line shows power and false-positive rates for Δm,n,2. The black line shows the power and false-positive rates for Chim-Sp, a single-breakpoint no-window Chimaera implementation (described on p. 14 of the supplemental materials of Posada and Crandall 2001) whose P-values were calculated using the method of Spencer (2003). The gray line shows the power and false-positive rates of Chim-2006, a new Chimaera implementation with a sliding-window and sliding-breakpoint scheme; P-values were computed by permuting alignment columns 1000 times. The blue line shows the power and false-positive rates for MR-30,1 (Martin–Rybicki method with window size 30 nt and step size 1 nt). The third column shows ratio of power to false-positive rate at α = ∞. False-positive rates at α = ∞ were calculated with 1000 simulated triplets; all other data points were calculated with 100 simulated triplets. α = ∞ in the left column; ρ = 0 in the middle column.
F<sc>igure</sc> 4.—
Figure 4.—
Phylogenetic tree that shows a possible clonal evolutionary history for the sequences p, q, and c. Mutations occurring in branch 1 will result in an informative site of type Q, while mutations occurring in branch 2 will result in an informative site of type P. The distributions describing the probability that the mutations in branch 1 or 2 cluster on either side of a breakpoint or between some pair of breakpoints are those of Δm,n,1 and Δm,n,2.

References

    1. Ardlie, K. G., L. Kruglyak and M. Seielstad, 2002. Patterns of linkage disequilbrium in the human genome. Nat. Rev. Genet. 3 299–309. - PubMed
    1. Awadalla, P., 2003. The evolutionary genomics of pathogen recombination. Nat. Rev. Genet. 4 50–60. - PubMed
    1. Awadalla, P., A. Eyre-Walker and J. Maynard Smith, 1999. Linkage disequilibrium and recombination in hominid mitochondrial DNA. Science 286 2524–2525. - PubMed
    1. Balding, D. J., R. A. Nichols and D. M. Hunt, 1992. Detecting gene conversion: primate visual pigment genes. Proc. R. Soc. Lond. Ser. B 249 275–280. - PubMed
    1. Barton, D. E., and C. L. Mallows, 1965. Some aspects of the random sequence. Ann. Math. Stat. 36 236–260.

Publication types