

doi: 10.1534/genetics.106.067215.
Epub 2007 Apr 3.
Adaptation of a quantitative trait to a moving optimum
Affiliations
- PMID: 17409085
- PMCID: PMC1893041
- DOI: 10.1534/genetics.106.067215
Item in Clipboard
Adaptation of a quantitative trait to a moving optimum
Genetics.
2007 May.
Abstract
We investigate adaptive evolution of a quantitative trait under stabilizing selection with a moving optimum. We characterize three regimes, depending on whether (1) the beneficial mutation rate, (2) the fixation time, or (3) the rate of environmental change is the limiting factor for adaptation. If the environment is rate limiting, mutations with a small phenotypic effect are preferred over large mutations, in contrast to standard theory.
Figures
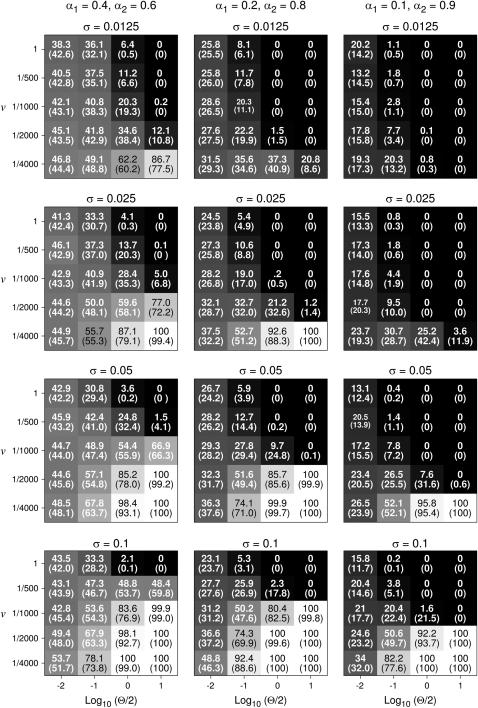
The probability πsmall (in percentage) of simulations where the mutant allele at the minor locus fixes before the mutant allele at the major locus, as a function of the population-wide mutation rate Θ/2 = Nμ (assuming μ = 10−5), the speed of the environmental change v, the selection strength σ, and the mutational effects of the two loci, α1 and α2. πsmall is also indicated by shades of gray, with black corresponding to 0% and white to 100%. The results are based on 1000 simulation for each parameter combination. Numbers in parentheses show the prediction from the analytical approximation (Equation A7). Similar results were obtained when N was fixed at 106 and μ varied between 10−8 to 10−5 (not shown).
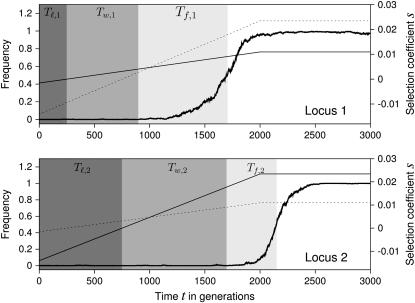
Example simulation run, in which the mutant allele at the minor locus (locus 1) fixes first. In each plot, the thick solid line shows the frequency of the mutant allele at the respective locus, and the thin solid line shows the selection coefficient s (in the approximation A5) over time. The dotted line shows the selection coefficient for the other locus. Shading marks the time periods used in the analytical approximation. Tl is the lag time during which the mutant allele is deleterious, Tw is the waiting time for a successful mutation, and Tf is the fixation time (i.e., the time until the mutant allele reaches frequency 0.5). Note that Tl,1 < T l,2 but Tf,1 > Tf,2. Parameters: α1 = 0.25, α2 = 0.75, μ = 10−5, N = 104, σ = 0.025, v = 1/2000.
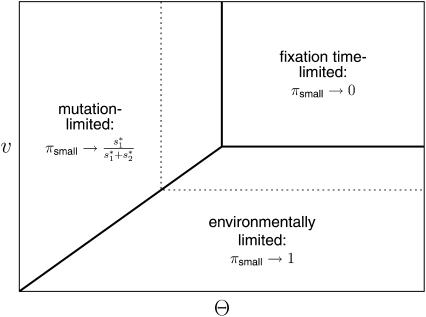
Schematic overview of the behavior of πsmall as a function of the population-wide mutation rate, Θ, and the speed of the environmental change, v. As outlined in the main text, there are three main regimes, depending on the dominating time scale (i.e., on which of the three time periods in Figure 2 is longest). The dotted line shows how the boundaries of the regimes shift as the selection parameter σ becomes smaller.
References
-
- Bello, Y., and D. Waxman, 2006. Near-periodic substitutions and the genetic variance induced by environmental change. J. Theor. Biol. 239: 152–160. - PubMed
-
- Bürger, R., 2000. The Mathematical Theory of Selection, Recombination, and Mutation. Wiley, Chichester, UK.
-
- Crow, J. F., and M. Kimura, 1970. An Introduction to Population Genetics Theory. Harper & Row, New York.
-
- Eaton, J., 1997. GNU Octave Manual, Ed. 3. Network Theory Ltd., Bristol, UK.
-
- Galassi, M., J. Davies, J. Theiler, B. Gough, G. Jungman et al., 2005. GNU Scientific Library Reference Manual, Ed. 2. Network Theory Ltd., Bristol, UK.
Publication types
MeSH terms
LinkOut - more resources
Full Text Sources
