. 2007 May;176(1):501-11.
doi: 10.1534/genetics.106.063636. Epub 2007 Apr 3.

Evolution of coadaptation in a subdivided population

Affiliations

Evolution of coadaptation in a subdivided population

K Ryo Takahasi. Genetics. 2007 May.

Abstract

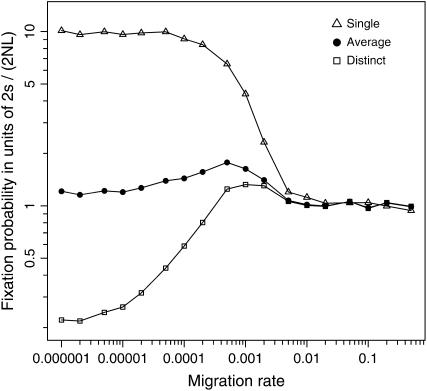
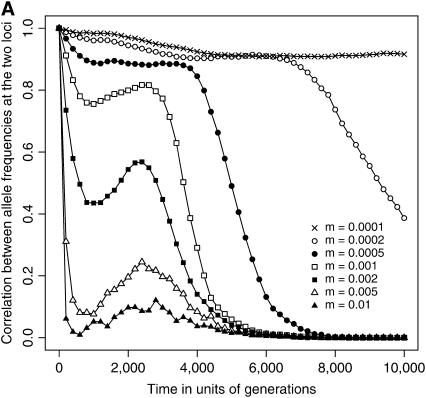
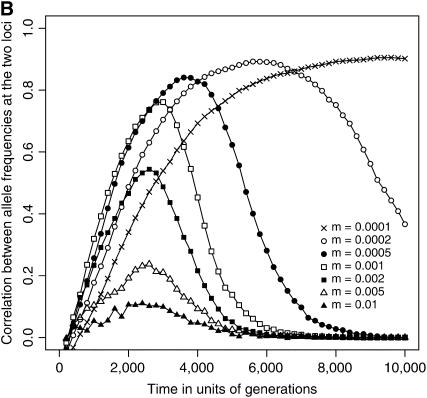
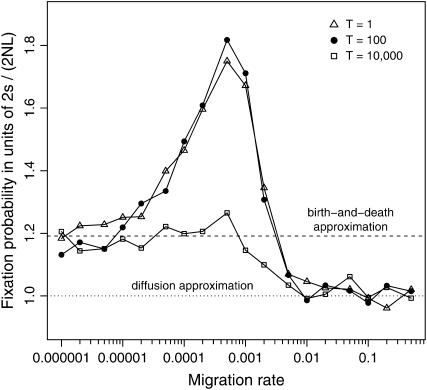
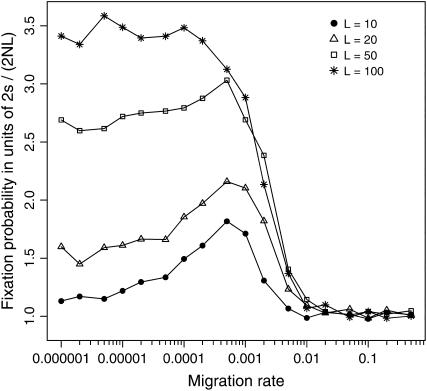
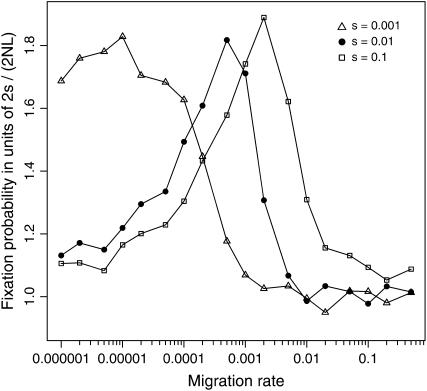
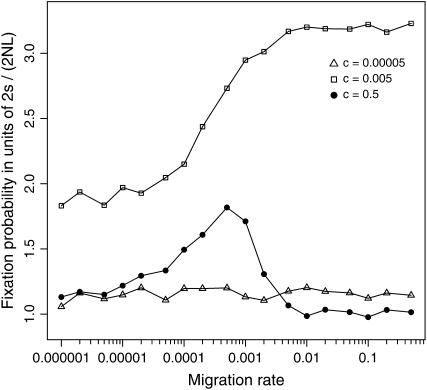
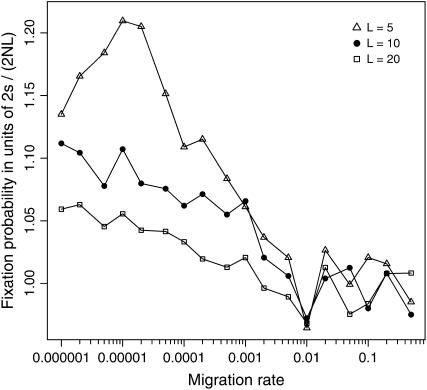
The interplay between population subdivision and epistasis is investigated by studying the fixation probability of a coadapted haplotype in a subdivided population. Analytical and simulation models are developed to study the evolutionary fate of two conditionally neutral mutations that interact epistatically to enhance fitness. We find that the fixation probability of a coadapted haplotype shows a marked increase when the population is genetically subdivided and subpopulations are loosely connected by migration. Moderate migration and isolation allow the propagation of the mutant alleles across subpopulations, while at the same time preserving the favorable allelic combination established within each subpopulation. Together they create the condition most favorable for the ultimate fixation of the coadapted haplotype. On the basis of the analytical and simulation results, we discuss the fundamental role of population subdivision and restricted gene flow in promoting the evolution of functionally integrated systems, with some implications for the shifting-balance theory of evolution.


Figures

F<sc>igure</sc> 1.—
Figure 1.—
Fixation probabilities of two new mutations that arise simultaneously (T = 0). Simulation results are illustrated for two mutations that co-occur initially in a single subpopulation (open triangles) and for mutations that arise in two distinct subpopulations (open squares). Noting that the former situation should occur with probability 1/L and the latter with probability (1 − 1/L), average (unconditional) values (solid circles) are obtained by appropriately taking the weighted sum of the two conditional probabilities. Parameters are N = 1000, L = 10 (NT = 10,000), s = 0.01, and c = 0.5.
F<sc>igure</sc> 2.—
Figure 2.—
Temporal dynamics of the correlation between allele frequencies at the two loci across subpopulations. Simulation results, conditional on the eventual fixation of the coadapted haplotype, are illustrated for 0.0001 ≤ m ≤ 0.01. (A) Two new mutations initially co-occur in a single subpopulation. (B) Mutations are initially introduced into two distinct subpopulations. The abscissa designates the time (in generations) since the introduction of the two mutations, and the ordinate gives the correlation coefficient, averaged over the 1000 replicate runs that resulted in double fixation. As in Figure 1, parameters are N = 1000, L = 10 (NT = 10,000), s = 0.01, c = 0.5, and T = 0.
F<sc>igure</sc> 3.—
Figure 3.—
Effects of time difference between two mutational events on the fixation probability of the coadapted haplotype A1B1 in a subdivided population. Simulation results are illustrated for T = 1, 100, and 10,000. Other parameters are N = 1000, L = 10 (NT = 10,000), s = 0.01, and c = 0.5. Note that when T = 1 and 100, the results practically overlap with each other, whereas for T = 10,000, the effect of migration is less significant. Theoretical expectations derived from the diffusion and birth-and-death models are also illustrated; the scaled probabilities are 1.000 (dotted line, diffusion approximation) and 1.191 (dashed line, birth-and-death approximation), respectively.
F<sc>igure</sc> 4.—
Figure 4.—
Effects of subpopulation size and number on the fixation probability of the coadapted haplotype A1B1 in a subdivided population. Simulation results are illustrated for subdivided populations with L = 10, 20, 50, and 100. In each case, the total population size NT is kept constant (at 10,000) so that the subpopulation size N (= NT/L) is altered accordingly. Other parameters are s = 0.01, c = 0.5, and T = 100. Note that for L ≤ 50 the optimal migration rate mmax is almost invariant despite the changes in the subpopulation size N.
F<sc>igure</sc> 5.—
Figure 5.—
Effects of selection on the fixation probability of the coadapted haplotype A1B1 in a subdivided population. Simulation results are illustrated for s = 0.001, 0.01, and 0.1. Other parameters are N = 1000, L = 10 (NT = 10,000), c = 0.5, and T = 100. Note that the optimal migration rate mmax becomes greater with stronger selection (larger s).
F<sc>igure</sc> 6.—
Figure 6.—
Effects of linkage on the fixation probability of the coadapted haplotype A1B1 in a subdivided population. Simulation results are illustrated for c = 0.00005, 0.005, and 0.5 (i.e., free recombination). Other parameters are N = 1000, L = 10 (NT = 10,000), s = 0.01, and T = 100. The results recapture the preceding observation that the fixation probability is maximized by an intermediate degree of linkage, roughly when c = s/2 (Takahasi and Tajima 2005), although the effect of linkage becomes less pronounced as the migration rate becomes smaller.
F<sc>igure</sc> 7.—
Figure 7.—
Effects of population subdivision on the fixation probability of the coadapted haplotype A1B1 under weak epistatic selection (s = 0.001). Simulation results are illustrated for subdivided populations with L = 5, 10, and 20. In each case, the total population size NT is kept constant (at 2000) so that the subpopulation size N (= NT/L) is altered accordingly. Other parameters are c = 0.5 and T = 1.

Similar articles

Cited by

References

    1. Barton, N. H., 1993. The probability of fixation of a favoured allele in a subdivided population. Genet. Res. 62: 149–157.
    1. Briggs, C. J., and M. F. Hoopes, 2004. Stabilizing effects in spatial parasitoid-host and predator-prey models: a review. Theor. Popul. Biol. 65: 299–315. - PubMed
    1. Burch, C. L., and L. Chao, 1999. Evolution by small steps and rugged landscapes in the RNA virus φ6. Genetics 151: 921–927. - PMC - PubMed
    1. Chave, J., H. C. Muller-Landau and S. A. Levin, 2002. Comparing classical community models: theoretical consequences for patterns of diversity. Am. Nat. 159: 1–23. - PubMed
    1. Cherry, J. L., 2003. a Selection in a subdivided population with dominance or local frequency dependence. Genetics 163: 1511–1518. - PMC - PubMed

Publication types