. 2007 Jun;81(12):6742-51.
doi: 10.1128/JVI.00022-07. Epub 2007 Apr 4.

Effective T-cell responses select human immunodeficiency virus mutants and slow disease progression

Affiliations

Effective T-cell responses select human immunodeficiency virus mutants and slow disease progression

A J Frater et al. J Virol. 2007 Jun.

Abstract

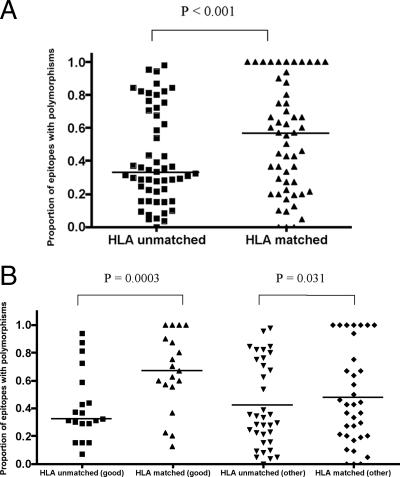
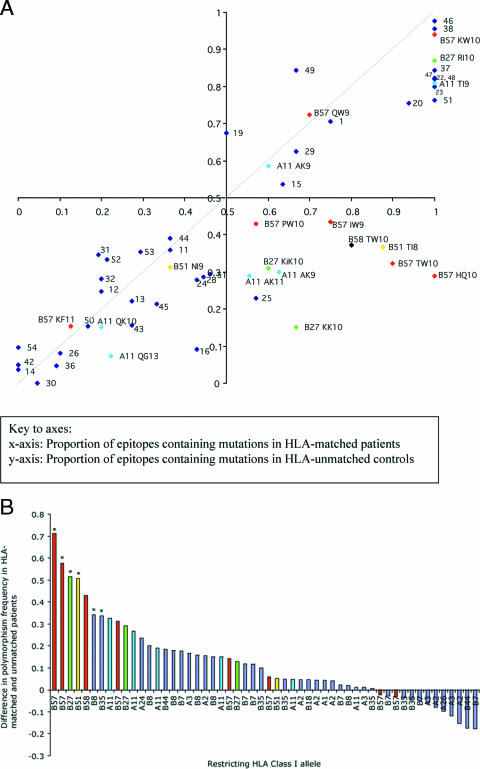
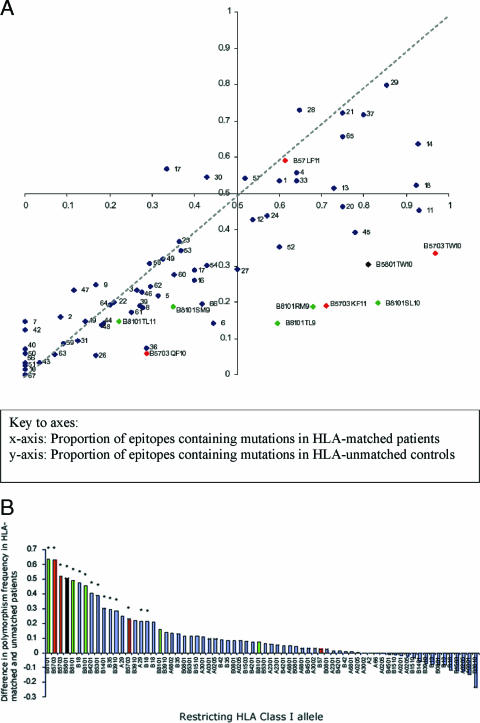
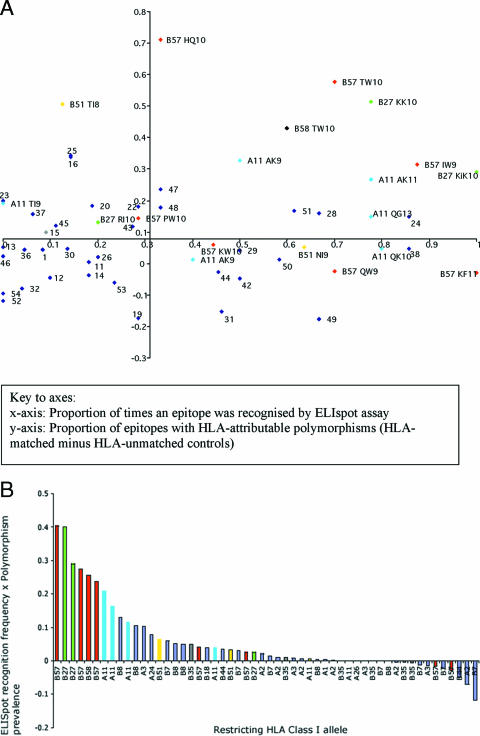
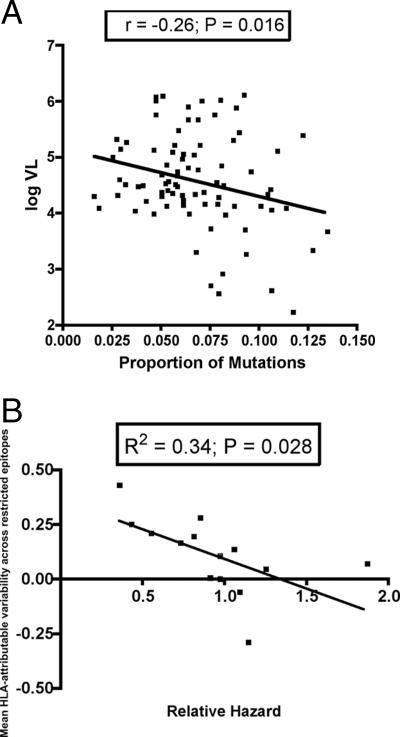
The possession of some HLA class I molecules is associated with delayed progression to AIDS. The mechanism behind this beneficial effect is unclear. We tested the idea that cytotoxic T-cell responses restricted by advantageous HLA class I molecules impose stronger selection pressures than those restricted by other HLA class I alleles. As a measure of the selection pressure imposed by HLA class I alleles, we determined the extent of HLA class I-associated epitope variation in a cohort of European human immunodeficiency virus (HIV)-positive individuals (n=84). We validated our findings in a second, distinct cohort of African patients (n=516). We found that key HIV epitopes restricted by advantageous HLA molecules (B27, B57, and B51 in European patients and B5703, B5801, and B8101 in African patients) were more frequently mutated in individuals bearing the restricting HLA than in those who lacked the restricting HLA class I molecule. HLA alleles associated with clinical benefit restricted certain epitopes for which the consensus peptides were frequently recognized by the immune response despite the circulating virus's being highly polymorphic. We found a significant inverse correlation between the HLA-associated hazard of disease progression and the mean HLA-associated prevalence of mutations within epitopes (P=0.028; R2=0.34). We conclude that beneficial HLA class I alleles impose strong selection at key epitopes. This is revealed by the frequent association between effective T-cell responses and circulating viral escape mutants and the rarity of these variants in patients who lack these favorable HLA class I molecules, suggesting a significant pressure to revert.


Figures

FIG. 1.
FIG. 1.
Proportion of optimal epitopes containing polymorphisms in HLA-matched and HLA-unmatched (control) patients. (A) For each of the 54 HLA class I-restricted optimal epitopes in the Swiss cohort, the proportion of variant sequences was calculated in patients expressing the relevant HLA class I allele (matched) and in a control group of patients not carrying that allele (unmatched). The figure shows the distribution of variation in the matched and unmatched groups (Wilcoxon signed-rank test). Statistical significance remained after removal of epitopes with 100% variation from the analysis (P = 0.0007) (data not shown). (B) Epitopes were divided according to whether they were restricted by good (HLA-A*11, -B*27, -B*51, -B*57, and -B*58, which are associated with clinical advantage) or other (not associated with clinical advantage) HLA class I alleles. The proportion of variants in each group was compared using the Wilcoxon signed-rank test.
FIG. 2.
FIG. 2.
Prevalence of mutations within epitopes in HLA-matched and HLA-unmatched control patients in a Swiss cohort. (A) Patients are from the Swiss HIV cohort (n = 84). For 54 HLA class I-restricted optimal epitopes, the proportion of variant sequences in patients expressing the relevant HLA class I allele (matched) is plotted on the x axis, and the proportion of variant sequences in a control group of patients not carrying that allele (unmatched) is plotted on the y axis. The axes intersect at (0.5,0.5) rather than (0, 0) in order to define four equal quadrants within the figure. The dashed line represents x = y. Epitopes restricted by HLA-B27, -B51, -B57, -B58, and -A11 are color coded and labeled. All other epitopes are represented as numbered blue dots (see Table S1 in the supplemental material for a key to this labeling). (B) The difference between the proportions of polymorphic epitopes in the HLA-matched and -unmatched Swiss patients was calculated and plotted according to rank. To highlight the dominant contribution of the protective HLA class I alleles HLA-B57 and -B58, HLA-B27, HLA-B51, and HLA-A11, these epitopes are color coded; all other epitopes are represented in blue. An asterisk above a column indicates a P value of <0.05 for the distribution of variant epitopes in HLA-matched and -unmatched populations for each epitope using Fisher's exact test.
FIG. 3.
FIG. 3.
Prevalence of mutations within epitopes in HLA-matched and HLA-unmatched control patients in an African cohort. (A) Patients are from the African HIV cohort (n = 512). For 70 HLA class I-restricted optimal epitopes, the proportion of variant sequences in patients expressing the relevant HLA class I allele (matched) is plotted on the x axis, and the proportion of variant sequences in a control group of patients not carrying that allele (unmatched) is plotted on the y axis. The axes intersect at (0.5,0.5) rather than (0,0) in order to define four equal quadrants within the figure. The dashed line represents x = y. The epitopes restricted by HLA-B5703, -B5801, and -B8101 are color coded and labeled. All other epitopes are represented as numbered blue dots (see Table S2 in the supplemental material for a key to the numbering). (B) The difference between the proportions of polymorphic epitopes in the HLA-matched and -unmatched African patients was calculated and displayed according to rank. To highlight the dominant contribution of the protective HLA class I alleles HLA-B5703, HLA-B5801, and HLA-B8101, these epitopes are color coded as shown; all other epitopes are represented in blue. An asterisk above a column indicates a P value of <0.05 for each epitope using Fisher's exact test.
FIG. 4.
FIG. 4.
Frequency of epitope recognition by ELISPOT and prevalence of intraepitopic polymorphisms. (A) Each optimal epitope was represented on a plot according to the proportion of patients who recognized it in a gamma interferon ELISPOT assay (x axis) and the difference in proportions of polymorphic sites in the HLA-matched and -unmatched patients (y axis). The axes intersect at the median value for each distribution. Epitopes restricted by protective (HLA-B27, -B57, -B58, and -A11) HLA class I molecules are labeled (restricting HLA class I allele and epitope abbreviation) and color coded. All other alleles are represented in blue and are numbered (a key to the numbering is available in Table S1 of the supplemental material). (B) A score was calculated for each epitope based on the product of the proportion of times it was recognized in an ELISPOT assay and the difference in proportion of variant sequences in HLA-matched and -unmatched patients. This quality score is presented plotted in order of rank. The epitopes restricted by HLA-B57 and -B58, HLA-B27, HLA-B51, and HLA-A11 are color coded; all other epitopes are represented in blue.
FIG. 5.
FIG. 5.
Epitope variability predicts plasma viral load and relative hazard of disease progression. (A) For each patient the proportion of sequence variants in 54 optimal epitopes in the Gag, Pol, and Nef genes was calculated and correlated with baseline plasma viral load, using Pearson's correlation coefficient. (B) For each epitope the difference in the proportion of variant epitopes in HLA-matched and -unmatched patients was calculated. A mean value for each HLA class I molecule was then calculated from all the epitopes restricted by each HLA class I allele. These values were used as a measure of polymorphic variability associated with each HLA class I molecule and correlated negatively with the associated relative hazard of disease progression for each HLA class I allele.

References

    1. Addo, M. M., X. G. Yu, A. Rathod, D. Cohen, R. L. Eldridge, D. Strick, M. N. Johnston, C. Corcoran, A. G. Wurcel, C. A. Fitzpatrick, M. E. Feeney, W. R. Rodriguez, N. Basgoz, R. Draenert, D. R. Stone, C. Brander, P. J. Goulder, E. S. Rosenberg, M. Altfeld, and B. D. Walker. 2003. Comprehensive epitope analysis of human immunodeficiency virus type 1 (HIV-1)-specific T-cell responses directed against the entire expressed HIV-1 genome demonstrate broadly directed responses, but no correlation to viral load. J. Virol. 77:2081-2092. - PMC - PubMed
    1. Allen, T. M., D. H. O'Connor, P. Jing, J. L. Dzuris, B. R. Mothe, T. U. Vogel, E. Dunphy, M. E. Liebl, C. Emerson, N. Wilson, K. J. Kunstman, X. Wang, D. B. Allison, A. L. Hughes, R. C. Desrosiers, J. D. Altman, S. M. Wolinsky, A. Sette, and D. I. Watkins. 2000. Tat-specific cytotoxic T lymphocytes select for SIV escape variants during resolution of primary viraemia. Nature 407:386-390. - PubMed
    1. Altfeld, M., E. T. Kalife, Y. Qi, H. Streeck, M. Lichterfeld, M. N. Johnston, N. Burgett, M. E. Swartz, A. Yang, G. Alter, X. G. Yu, A. Meier, J. K. Rockstroh, T. M. Allen, H. Jessen, E. S. Rosenberg, M. Carrington, and B. D. Walker. 2006. HLA alleles associated with delayed progression to AIDS contribute strongly to the initial CD8(+) T cell response against HIV-1. PLOS Med. 3:e403. doi:10.1371/journal.pmed.0030403. - DOI - PMC - PubMed
    1. Bailey, J. R., T. M. Williams, R. F. Siliciano, and J. N. Blankson. 2006. Maintenance of viral suppression in HIV-1-infected HLA-B*57+ elite suppressors despite CTL escape mutations. J. Exp. Med. 203:1357-1369. - PMC - PubMed
    1. Deeks, S. G., J. D. Barbour, J. N. Martin, M. S. Swanson, and R. M. Grant. 2000. Sustained CD4+ T cell response after virologic failure of protease inhibitor-based regimens in patients with human immunodeficiency virus infection. J. Infect. Dis. 181:946-953. - PubMed

Publication types