. 2007 Jun;81(12):6389-401.
doi: 10.1128/JVI.02172-06. Epub 2007 Apr 4.

Chromatin profiling of Epstein-Barr virus latency control region

Affiliations

Chromatin profiling of Epstein-Barr virus latency control region

Latasha Day et al. J Virol. 2007 Jun.

Abstract

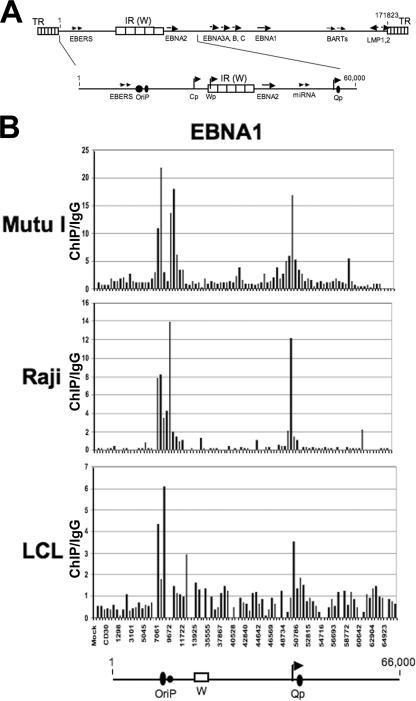
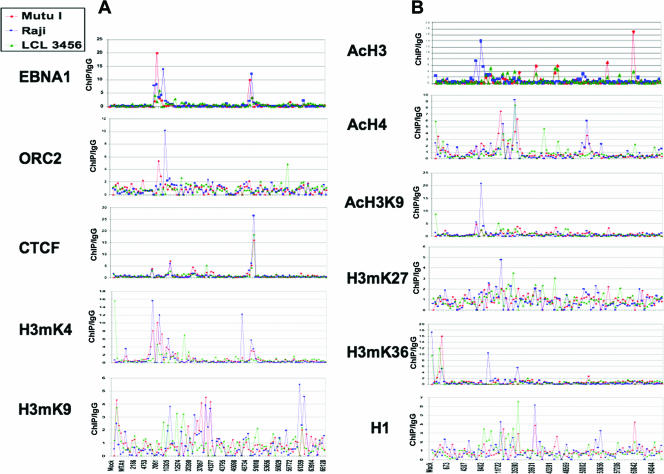
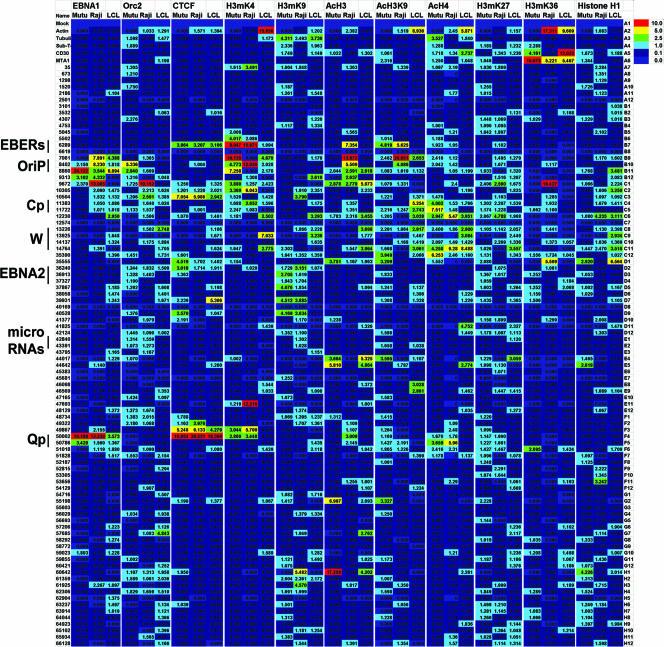
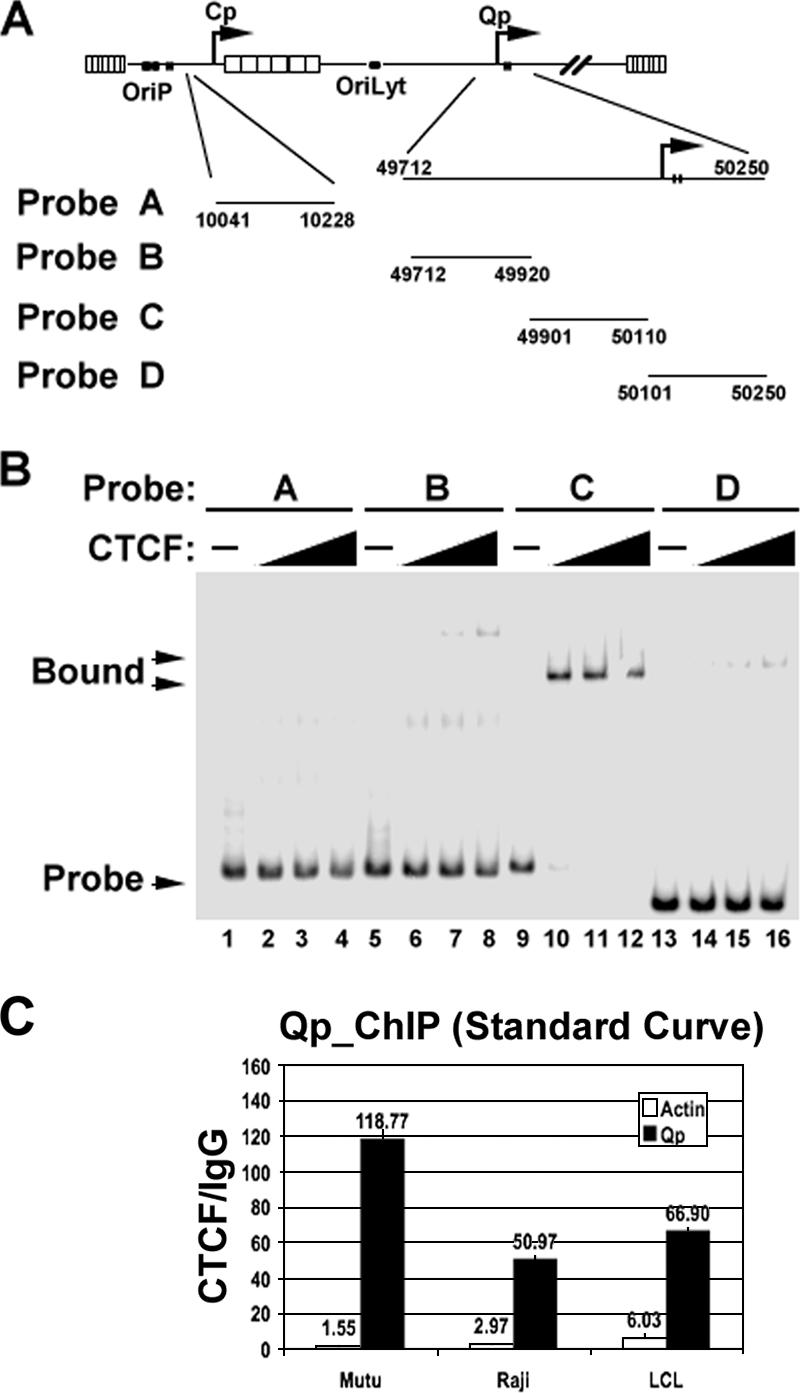
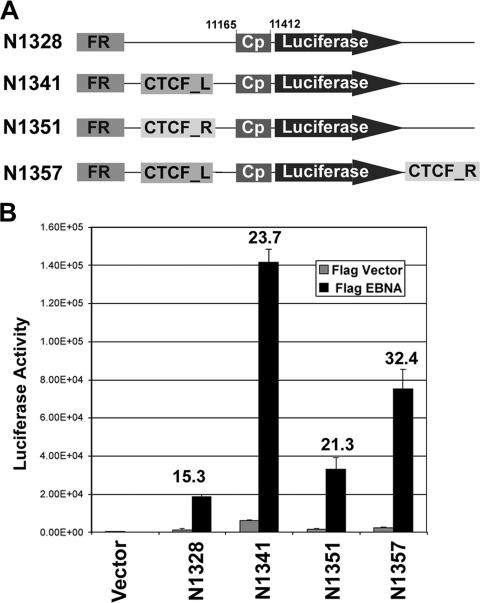
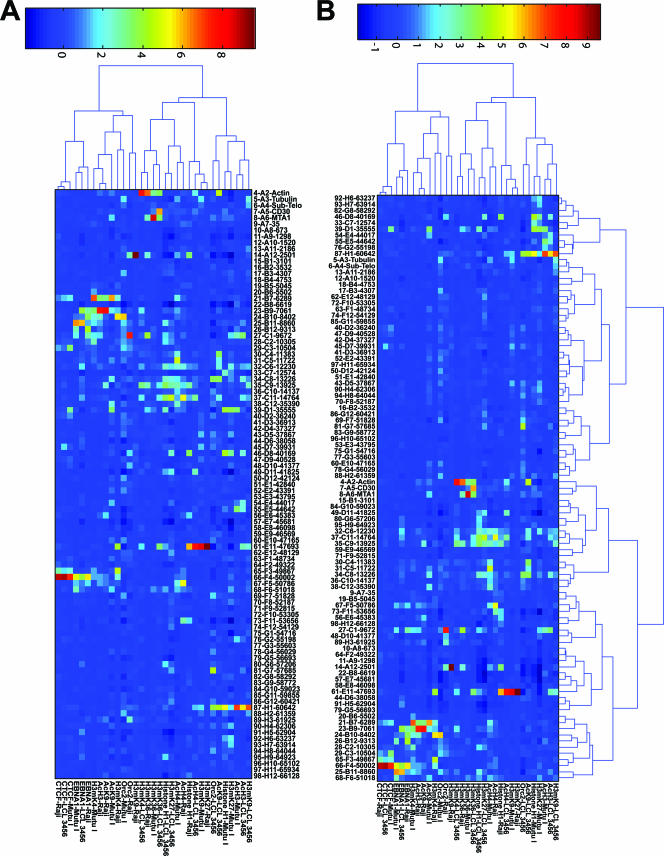
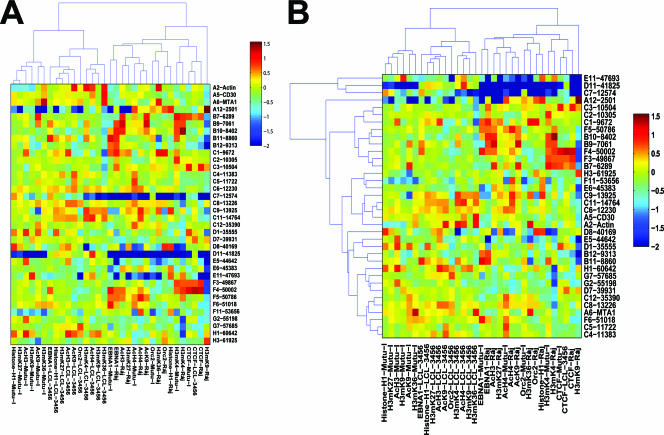
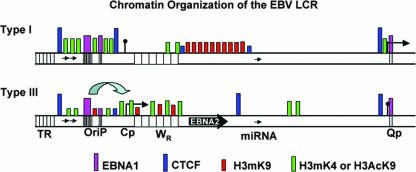
Epstein-Barr virus (EBV) escapes host immunity by the reversible and epigenetic silencing of immunogenic viral genes. We previously presented evidence that a dynamic chromatin domain, which we have referred to as the latency control region (LCR), contributes to the reversible repression of EBNA2 and LMP1 gene transcription. We now explore the protein-DNA interaction profiles for a few known regulatory factors and histone modifications that regulate LCR structure and activity. A chromatin immunoprecipitation assay combined with real-time PCR analysis was used to analyze protein-DNA interactions at approximately 500-bp intervals across the first 60,000 bp of the EBV genome. We compared the binding patterns of EBNA1 with those of the origin recognition complex protein ORC2, the chromatin boundary factor CTCF, the linker histone H1, and several histone modifications. We analyzed three EBV-positive cell lines (MutuI, Raji, and LCL3459) with distinct transcription patterns reflecting different latency types. Our findings suggest that histone modification patterns within the LCR are complex but reflect differences in each latency type. The most striking finding was the identification of CTCF sites immediately upstream of the Qp, Cp, and EBER transcription initiation regions in all three cell types. In transient assays, CTCF facilitated EBNA1-dependent transcription activation of Cp, suggesting that CTCF coordinates interactions between different chromatin domains. We also found that histone H3 methyl K4 clustered with CTCF and EBNA1 at sites of active transcription or DNA replication initiation. Our findings support a model where CTCF delineates multiple domains within the LCR and regulates interactions between these domains that correlate with changes in gene expression.


Figures

FIG. 1.
FIG. 1.
(A) Schematic of salient features of the latent EBV genome, with focus on the first 66 kb, which was used for ChIP array studies. (B) Bar graph representation of ChIP array data for EBNA1 binding sites in the genomes of MutuI (top), Raji (middle), and LCL (bottom) cells. The positions of OriP, the W repeat, and Qp in the bar graph are aligned with the line drawing of the EBV genome below.
FIG. 2.
FIG. 2.
Line graphs representing average distances from the mean (y axis) for each antibody indicated to the left. Mutu I (red), Raji (blue), and LCL (green) cell data are shown by overlapping lines across the positions of the EBV genome array, indicated by the x axis.
FIG. 3.
FIG. 3.
Color chart analysis of ChIP data. EBV genome positions are indicated in the vertical axis to the left. Antibodies are indicated above for each set of three columns. Each column of each antibody set represents the analysis for a particular cell type (MutuI, Raji, or LCL cells). The values were normalized as distances from the mean for each column. Values of >10-fold above the mean (red), 5-fold above the mean (yellow), 2.5-fold above the mean (green), or 1.0-fold above the mean (cyan) were considered significant binding. Values of <1.0-fold above the mean are presented in light blue, and values deemed statistically insignificant or indeterminant are presented in dark blue.
FIG. 4.
FIG. 4.
EMSA analysis of CTCF binding to the Qp region. (A) Depiction of EBV genome regions used to generate probes for EMSA. The EBV coordinates are indicated for each probe used in panel B. (B) CTCF protein, expressed and purified from baculovirus, was tested at increasing concentrations for its ability to bind probe A (positions 10041 to 10228), probe B (positions 49712 to 49920), probe C (positions 49901 to 50110), or probe D (positions 50101 to 50250). Free probe and CTCF-bound fractions are indicated by arrows. (C) ChIP assay using real-time PCR and standard curve analysis with primer pairs specific for actin (white) or Qp (black). ChIP was performed with MutuI, Raji, and LCL cells, and data are presented as x-fold changes in CTCF binding relative to that of an IgG control.
FIG. 5.
FIG. 5.
CTCF binding sites facilitate EBNA1-dependent activation of Cp. (A) CTCF sites from positions 6001 to 6590 (CTCF_L) or positions 49712 to 50250 (CTCF_R) were inserted between the FR and the minimal BamHI Cp or downstream of the luciferase gene in plasmid N1328, as indicated. (B) Luciferase constructs were assayed in 293 cells transfected with control vector or an EBNA1 expression plasmid (FLAG-EBNA1). The x-fold activation by EBNA1 is indicated above each bar in the graph.
FIG. 6.
FIG. 6.
Hierarchical clustering of complete ChIP data set. (A) Clustering was performed on cells and antibodies, with the genome position fixed. (B) Clustering was performed on both cells and antibodies (x axis) as well as on genome positions (y axis).
FIG. 7.
FIG. 7.
Hierarchical clustering of significant binding sites only. (A) Clustering analysis of cells and antibodies, with the genome position fixed. (B) Clustering analysis of cells and antibodies (y axis) as well as genome positions (x axis).
FIG. 8.
FIG. 8.
Schematic of chromatin organization based on genome ChIP analysis of different EBV latency types. Type I is based on MutuI cells, and type III is based on LCL cells. CTCF is depicted in purple, EBNA1 is in red, the permissive chromatin H3mK4 is in green.

References

    1. Alazard, N., H. Gruffat, E. Hiriart, A. Sergeant, and E. Manet. 2003. Differential hyperacetylation of histones H3 and H4 upon promoter-specific recruitment of EBNA2 in Epstein-Barr virus chromatin. J. Virol. 77:8166-8172. - PMC - PubMed
    1. Altmann, M., D. Pich, R. Ruiss, J. Wang, B. Sugden, and W. Hammerschmidt. 2006. Transcriptional activation by EBV nuclear antigen 1 is essential for the expression of EBV's transforming genes. Proc. Natl. Acad. Sci. USA 103:14188-14193. - PMC - PubMed
    1. Ambinder, R. F., K. D. Robertson, and Q. Tao. 1999. DNA methylation and the Epstein-Barr virus. Semin. Cancer Biol. 9:369-375. - PubMed
    1. Atanasiu, C., Z. Deng, A. Wiedmer, J. Norseen, and P. M. Lieberman. 2006. ORC binding to TRF2 stimulates OriP replication. EMBO Rep. 7:716-721. - PMC - PubMed
    1. Babcock, G. J., L. L. Decker, M. Volk, and D. A. Thorley-Lawson. 1998. EBV persistence in memory B cells in vivo. Immunity 9:395-404. - PubMed

Publication types

LinkOut - more resources