Comparative Study
. 2007 Apr 4;27(14):3626-38.
doi: 10.1523/JNEUROSCI.4406-06.2007.

Removal of GABA within adult modulatory systems alters electrical coupling and allows expression of an embryonic-like network

Affiliations
Comparative Study

Removal of GABA within adult modulatory systems alters electrical coupling and allows expression of an embryonic-like network

Eric Ducret et al. J Neurosci. .

Abstract

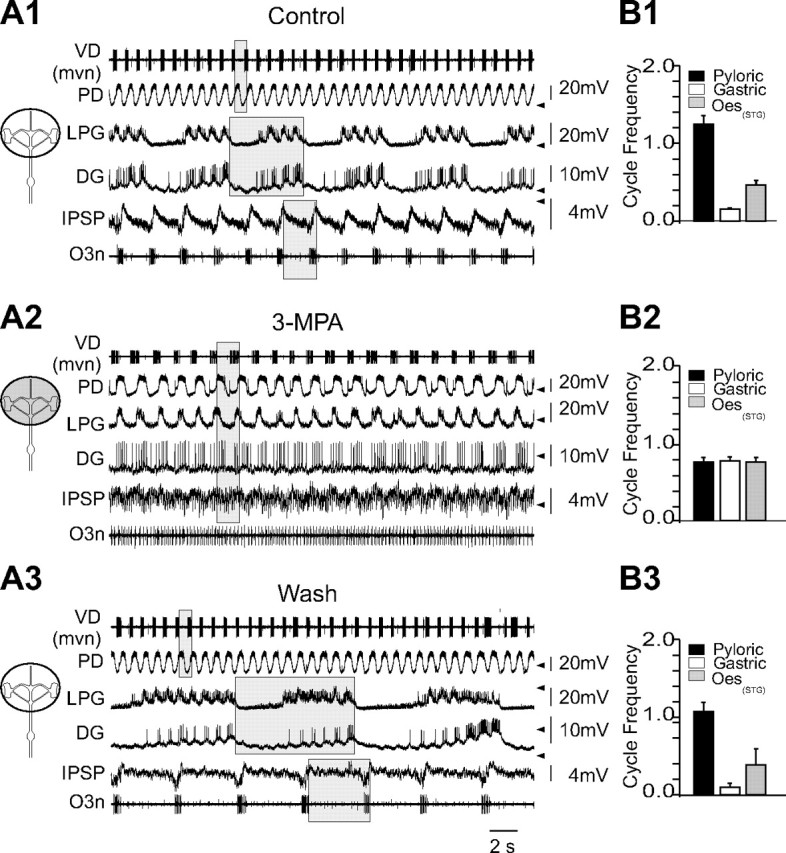
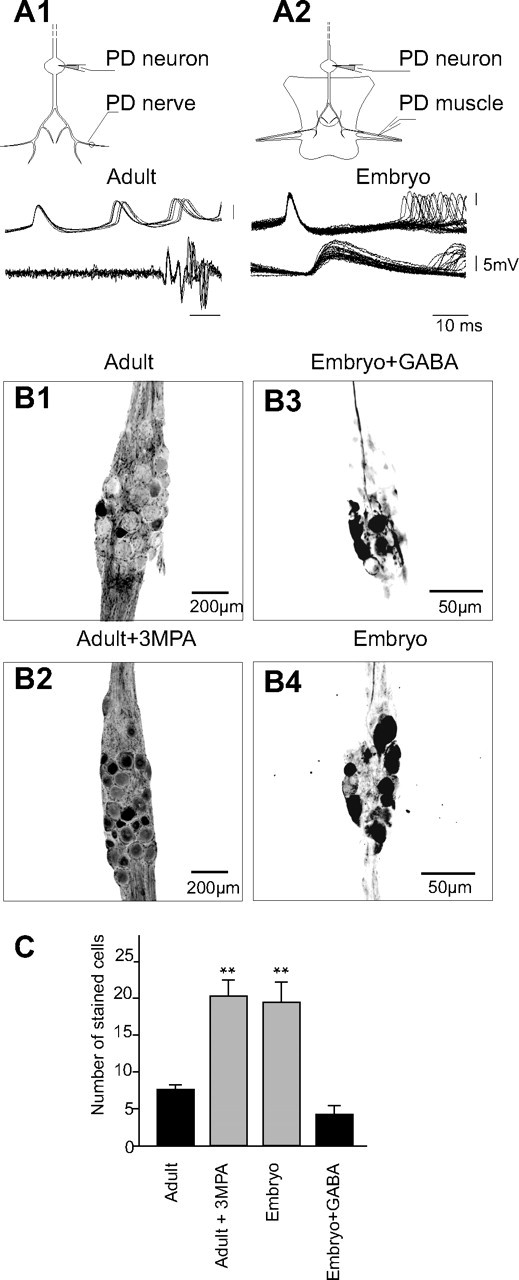
The maturation and operation of neural networks are known to depend on modulatory neurons. However, whether similar mechanisms may control both adult and developmental plasticity remains poorly investigated. To examine this issue, we have used the lobster stomatogastric nervous system (STNS) to investigate the ontogeny and role of GABAergic modulatory neurons projecting to small pattern generating networks. Using immunocytochemistry, we found that modulatory input neurons to the stomatogastric ganglion (STG) express GABA only after metamorphosis, a time that coincides with the developmental switch from a single to multiple pattern generating networks within the STNS. We demonstrate that blocking GABA synthesis with 3-mercapto-propionic acid within the adult modulatory neurons results in the reconfiguration of the distinct STG networks into a single network that generates a unified embryonic-like motor pattern. Using dye-coupling experiments, we also found that gap-junctional coupling is greater in embryos and GABA-deprived adults exhibiting the unified motor pattern compared with control adults. Furthermore, GABA was found to diminish directly the extent and strength of electrical coupling within adult STG networks. Together, these observations suggest the acquisition of a GABAergic phenotype by modulatory neurons after metamorphosis may induce the reconfiguration of the single embryonic network into multiple adult networks by directly decreasing electrical coupling. The findings also suggest that adult neural networks retain the ability to express typical embryonic characteristics, indicating that network ontogeny can be reversed and that changes in electrical coupling during development may allow the segregation of multiple distinct functional networks from a single large embryonic network.


Figures

Figure 1.
Figure 1.
GABA is expressed early in development throughout the brain and the ventral nerve cord of H. gammarus. Immunocytochemical detection of GABA within the cerebroïd ganglia (top) and the lower part of ventral nerve cord (the 5 last thoracic ganglia and the 6 abdominal ganglia; bottom) of embryonic (E85; left), larval (middle; fourth larval stage) and juvenile (right) animals reveal the presence of numerous GABA-immunoreactive clusters of cells and neuropil that can be observed as early as midembryonic development. Reconstructed images were obtained by aligning maximal projections of confocal stacks containing 20–40 optical sections. For embryo and LIV, brain and nerve cord are from different preparations. Note that the sixth abdominal ganglion is missing in the LIV.
Figure 2.
Figure 2.
GABA appears within the modulatory input system to the STG after metamorphosis. A1, A2, Position of the main STNS ganglia depicted on schematic drawings of the embryonic (A1) and adult (A2) STNS. B, Microphotographs of GABA immunoreactivity in the CoG (top), STG (middle), and OG (bottom) observed at different developmental stages. Note the intense staining in the CoG of embryonic, larval, and postmetamorphic (LIV, juvenile, and adult) stages. In juvenile CoG, letters indicate the presence of stained neuropil (n), somata (s), and fibers (f). GABA staining can only be detected in the STG after metamorphosis. Indeed no staining is visible in the STG in premetamorphic (embryo, LIII) animals whereas in postmetamorphic animals, a faint neuropil is visible within the most anterior part of the STG. Note that the inset in the adult STG micrograph illustrates strongly stained fibers entering an other STG (see Results, Acquisition of GABA in the developing lobster nervous system). Scale bar, 100 μm. Similarly, embryonic and larval (LIII) OG usually display no GABA-immunoreactive cells whereas, typically, several soma are stained in the LIV, juvenile, and adult OG. All images are maximal projections of 20–40 optical sections. C, Distribution of the number of OG-stained soma for each developmental stage. D, Diagrams summarizing the chronology of appearance of GABA within the modulatory input system to the STG. The top panel shows the percentage of preparations in which a stained neuropil was observed within the STG for each developmental stage. The bottom panel shows the mean number of stained soma in the OG for each developmental stage (mean ± SEM). Note that the mean number of GABAergic OG soma in embryo, LII, and LIII is statistically different from the mean number observed in adult (*p < 0.005, one way ANOVA followed by Mann–Whitney test), whereas no statistically significant difference can be observed for LI OG (p = 0.05).
Figure 3.
Figure 3.
Bath-applied GABA inhibits the expression of spontaneous embryonic motor pattern. A–C, Superfusion of GABA on the whole STNS preparation (A), on the STG alone (B), or on the anterior ganglia alone (C) results in a complete cessation of the spontaneous embryonic rhythm monitored here through intramuscular recordings of pyloric muscles (PD, LP) and gastric muscles (DG, GM) in seven of eight, four of four, and three of three preparations, respectively. In all three cases, the spontaneous embryonic rhythm is restored after rinsing (recovery). In the case of GABA application on anterior ganglia, only preparations on which a single embryonic rhythm can be recorded in control conditions were included (3 of 10 preparations). The dissection of the anterior part of the preparation (a necessary step for selective application of GABA on anterior ganglia) can damage the modulatory system and precludes the expression of a single embryonic rhythm. Voltage levels (in millivolts) are indicated by arrowheads as follows: A, GM, −40, PD, −50; B, DG, −65, PD, −35; C, DG, −70, LP, −58.
Figure 4.
Figure 4.
Inhibition of GABA synthesis within adult anterior ganglia using 3-MPA induces the expression of a unified motor pattern within STG neurons. A1–A3, Electrophysiological recordings of the rhythmic activities produced by pyloric [ventral dilator (VD), PD], gastric (LPG, DG), and esophageal (IPSP, dilator esophageal) neurons in control conditions (A1), after 4 h of superfusion of 1 mm 3-MPA on the anterior ganglia (grayed area on the schematic drawing, A2), and after 1 h washing 3-MPA (A3). After 3-MPA treatment, a unified rhythmic motor pattern (A2) is produced in place of the three adult pyloric, gastric, and esophageal motor patterns (A1, A3). Gray boxes highlight the periods of the pyloric, gastric, esophageal (A1, A3) and unified (A2) rhythms. Note that the esophageal motor nerve does not display this unified rhythmic activity but instead fires tonically. PD, LPG, DG, and IPSP were recorded intracellularly whereas the activity of VD and dilator esophageal motoneuron was recorded extracellularly on the medial ventricular nerve (mvn) and esophageal nerve three (O3n; large spikes on the extracellular recording), respectively. Arrowheads on the side of the traces indicate voltage levels for PD (−60 mV), LPG (−60 mV), DG (−95 mV), and IPSP (−75 mV). B1–B3, Quantification of the mean cycle frequency of pyloric (PD), gastric (DG or LPG), or esophageal (IPSP) STG neurons measured in seven experiments in control conditions (B1), after 3-MPA application (B2), and after washing 3-MPA (B3; n = 2). For each experiment, cycle frequencies were measured over a period of at least 1 min. Error bars indicate SEM.
Figure 5.
Figure 5.
3-MPA application on anterior neuromodulatory ganglia induces a reduction of GABA within neuromodulatory inputs projecting to the STG in preparations expressing the unified motor pattern. A1–A4, Preparations expressing a unified rhythmic motor pattern after 3-MPA application (A1; n = 6) treated for immunocytochemical detection of GABA reveal reduced staining in the OG (A2, example of a preparation in which no GABAergic neuron could be detected) and in the CoG (A3) and the absence of neuropil in STG (n = 3 of 3) (A4, box on the right is an enlargement of a part of the STG). B1–B4, Preparations expressing three distinct rhythms after >4 h 3-MPA treatment (B1, quantification of pyloric, gastric, and esophageal cycle frequencies) (n = 5) treated for immunocytochemical detection of GABA reveal the presence of several stained soma in the OG (B2, example of a preparation in which 4 GABAergic neurons could be detected, an additional GABAergic soma being located out of the frame of this micrograph), numerous stained cell bodies as well as fibers in the CoG (B3), and neuropilar staining in the STG (B4, box on the right is an enlargement of a part of the STG). Note that A2A4 as well as B2B4 are from distinct preparations. Error bars indicate SEM.
Figure 6.
Figure 6.
3-MPA application on the STG does not alter the rhythmic motor patterns expressed by STG neurons. A1, A2, Intracellular electrophysiological recordings of the rhythmic activities produced by pyloric (PD), gastric (LPG), and esophageal (IPSP) neurons in control conditions (A1) and after 5 h of superfusion of 1 mm 3-MPA on the STG (A2, grayed area on the schematic drawing). Gray boxes on recordings highlight the periods of the pyloric, gastric, and esophageal rhythms. Arrowheads on the side of the traces indicate voltage levels for PD (−70 mV), LPG (−45 mV), and IPSP (−50 mV). B1, B2, Quantification of the mean cycle frequency of pyloric (PD), gastric (LPG), or esophageal (IPSP) STG neurons measured in three experiments in control conditions (B1) and after 3-MPA application on the STG (B2). For each experiment, cycle frequencies were measured over a period of at least 1 min. C1–C3, Immunocytochemical detection of GABA in preparations incubated in the presence of 3-MPA on the STG reveals the presence of four GABAergic somata in the OG (C1), numerous fibers and somata in the CoGs (C2), and faint neuropilar staining in the anterior part of the STG (C3, see high-magnification insert of neuropil staining in box). Error bars indicate SEM.
Figure 7.
Figure 7.
The unified activity produced by adult STG neurons under 3-MPA is generated by a single network. A, Distribution of firing as a function of the phase. The period of PD neuron was taken as a reference for phase computations (t = 0 for first spike in PD). Vertical bars represent the percentage of the total number of spikes that occurred within a given phase. For IPSP cells that never express spiking activity, the mean voltage variation that can be observed within a given phase is plotted (zero was taken at the onset of the first spike of PD neuron). Measurements were performed over 1–2 min (at least 35 cycles in each preparation). The number of preparations used for each neuron is indicated in parentheses. B1, B2, Brief (500–1500 ms) injections of hyperpolarizing current (−3 nA) in the soma of adult pyloric PD (B1) or gastric LPG (B2) neurons reset the ongoing activity of the unified rhythm, monitored here through extracellular [medial ventricular nerve (mvn) for ventral dilator (VD)] or intracellular recordings of two pyloric (VD, PD), two gastric (LPG, DG), and one esophageal (IPSP) neurons. Arrowheads above voltage traces indicate the expected firing time for each neuron in the absence of experimental perturbation. Arrowheads on the side of the traces indicate voltage levels for PD (−72 mV), LPG (−53 mV), DG (−45 mV), and IPSP (−35 mV). IC, Inferior cardiac.
Figure 8.
Figure 8.
The adult 3-MPA and the embryonic rhythms display similar phenotype of rhythmic patterned activities. A1, A2, Recordings of the unified rhythm in the adult 3-MPA treated (A1) and in the embryo (A2). Circles highlight the successive discharges of the recorded neurons in two consecutive cycles. In adult (A1) PD and DG were recorded intracellularly from neuron soma whereas LP and GM were recorded extracellularly from the motor nerves. Note that for both extracellular recordings (LP and GM), discharges of other neurons are visible on the nerves (PY and PD, respectively). The discharges of the neuron of interest are represented in black. In the embryo (A2), all traces are intracellular recordings of the target muscles of the same neuron as in A1. Voltage levels (in millivolts) are indicated by arrowheads as follows: A1, PD, −60, DG, −50; A2, LP, −80, PD, −75, GM, −70, DG, −60. B1, B2, Distribution of firing as a function of the phase in the adult (B1) and the embryonic (B2) single rhythm. The period of PD neuron was taken as a reference for phase computations (t = 0 for first spike in PD). Vertical bars represent the percentage of the total number of spikes that occurred within a given phase. Measurements were performed over 1–2 min (at least 35 cycles in each preparation). The number of preparations used for each neuron is indicated in parenthesis. Note that the overall sequence of activation is identical in both 3-MPA treated adult (B1) and in the embryo (B2).
Figure 9.
Figure 9.
The expression of the unified rhythmic activity both in the adult (3-MPA treated) and in the embryo is associated with an increase in the extent of dye-coupling. A1, A2, PD neurons were identified in the adult (A1) on the basis of a constant latency extracellular action potential recorded on PD motor nerve (A1, bottom traces, 7 superimposed traces) after each intracellularly recorded spike (A1, top traces), and on the basis of a constant latency excitatory junction potential recorded in the muscle in the embryo (A2, bottom traces for muscle and top traces for neuron, 26 superimposed traces). B1–B4, Neurobiotin injections of a PD neuron in control adult (B1), in the 3-MPA-treated adult (B2), and in the control embryonic (B4) and in the GABA-treated embryonic preparations (B3). All images are maximal projections of a full confocal stack of 49–67 images, each 2.5 μm thick. C, Quantification of the number of stained soma in the control adult (n = 10), the 3-MPA-treated adults (n = 7), the control embryos (n = 5), and the GABA-treated embryos (n = 4) reveals that the number of stained soma is significantly higher in the 3-MPA-treated adults and in the embryos compared with control adults as well as compared with GABA-treated embryos (**p < 0.001, one way ANOVA followed by Tukey's). Error bars indicate SEM.
Figure 10.
Figure 10.
GABA directly modulates the extent and strength of electrical coupling in the adult system. A1–A3, Neurobiotin injection into the soma of an identified adult PD neuron in control conditions (10−7 m TTX and 10−6 m PTX; A1) and after bath application of 10−3 m GABA (TTX, PTX; A2). The number of neurons dye-coupled to PD is significantly (*p < 0.01, t test) reduced after bath application of 10−3 m GABA (n = 5) compared with control preparations treated with 10−7 m TTX and 10−6 m PTX (n = 7; A3). Images are maximal projections of confocal stacks of 37–44 images, each 2.5 μm thick. B, Voltage deflection induced by the injection of a brief current pulse (0.5 s, −20 nA) into presynaptic (Vpre; top) and postsynaptic (Vpost; bottom) PDs in control conditions (10−7 m TTX and 10−6 m PTX), after 30 min of 10−3 m GABA and after 1 h wash of GABA. Because GABA induces a statistically significant hyperpolarization (−7.81 ± 1.56 mV, paired t test) of PD neurons in the experimental conditions used (TTX, PTX), the traces corresponding to control, GABA, and wash were overlaid for clarity. Membrane potentials were as follows: control, −63 mV (Vpre) and −57 mV (Vpost); GABA, −71.5 mV (Vpre) and −56 mV (Vpost); wash, −68 mV (Vpre) and −55.3 mV (Vpost). C1, C2, The input resistance of the presynaptic PD neuron in all conditions can be measured as the slope of the curve showing voltage variation as a function of the injected current (C1). Quantification of the normalized input resistance (C2) over four experiments reveals that GABA has no effect on the input resistance of the cell. Only the points corresponding to negative current pulses are represented in this figure (linear part of the input/output curve). D1, D2, The coupling coefficient of the two PDs can be measured as the slope of the curve showing the variation of postsynaptic voltage as a function of presynaptic voltage (D1). Quantification of the normalized coupling coefficient (D2) over four experiments shows that GABA induces a marked decrease in the coupling coefficient (**p < 0.0001, one way ANOVA followed by Tukey's test). Note that full recovery was never obtained after removing GABA (up to 2 h). Error bars indicate SEM.

Similar articles

Cited by

References

    1. Albert J, Lingle CJ, Marder E, O'Neil MB. A GABA-activated chloride-conductance not blocked by picrotoxin on spiny lobster neuromuscular preparations. Br J Pharmacol. 1986;87:771–779. - PMC - PubMed
    1. Allain AE, Meyrand P, Branchereau P. Ontogenic changes of the spinal GABAergic cell population are controlled by the serotonin (5-HT) system: implication of 5-HT1 receptor family. J Neurosci. 2005;25:8714–8724. - PMC - PubMed
    1. Arumugam H, Liu X, Colombo PJ, Corriveau RA, Belousov AB. NMDA receptors regulate developmental gap junction uncoupling via CREB signaling. Nat Neurosci. 2005;8:1720–1726. - PubMed
    1. Bem T, Le Feuvre Y, Simmers J, Meyrand P. Electrical coupling can prevent expression of adult-like properties in an embryonic neural circuit. J Neurophysiol. 2002;87:538–547. - PubMed
    1. Ben-Ari Y. Excitatory actions of GABA during development: the nature of the nurture. Nat Rev Neurosci. 2002;3:728–739. - PubMed

Publication types

MeSH terms

LinkOut - more resources