Comparative Study
. 2007 Apr 4;27(14):3823-38.
doi: 10.1523/JNEUROSCI.4719-06.2007.

T-type and L-type Ca2+ conductances define and encode the bimodal firing pattern of vestibulocerebellar unipolar brush cells

Affiliations
Comparative Study

T-type and L-type Ca2+ conductances define and encode the bimodal firing pattern of vestibulocerebellar unipolar brush cells

Marco A Diana et al. J Neurosci. .

Abstract

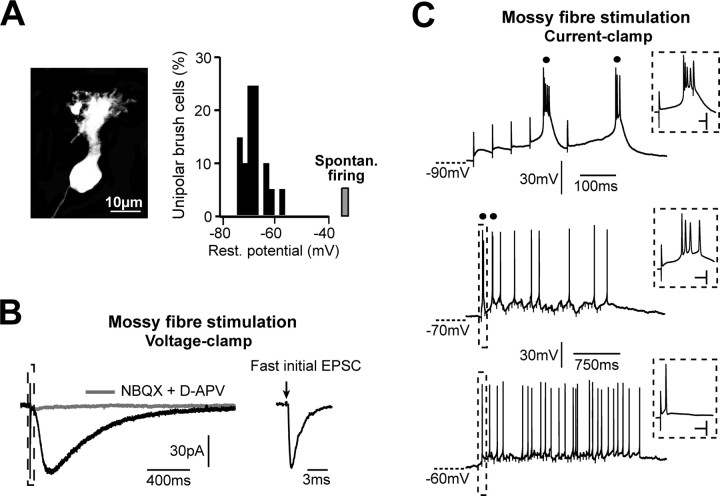
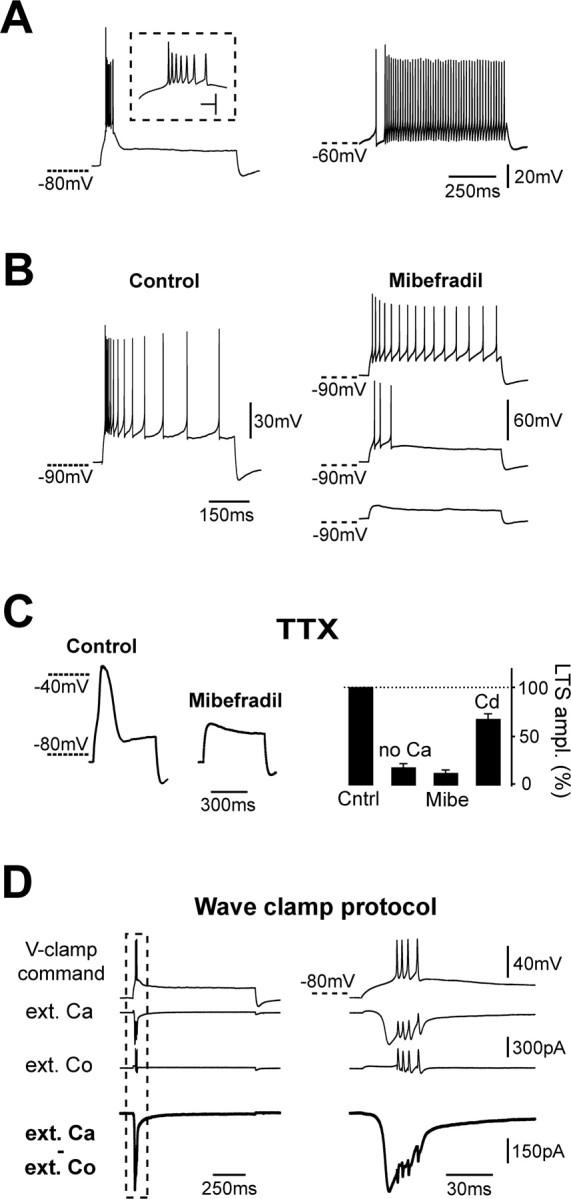
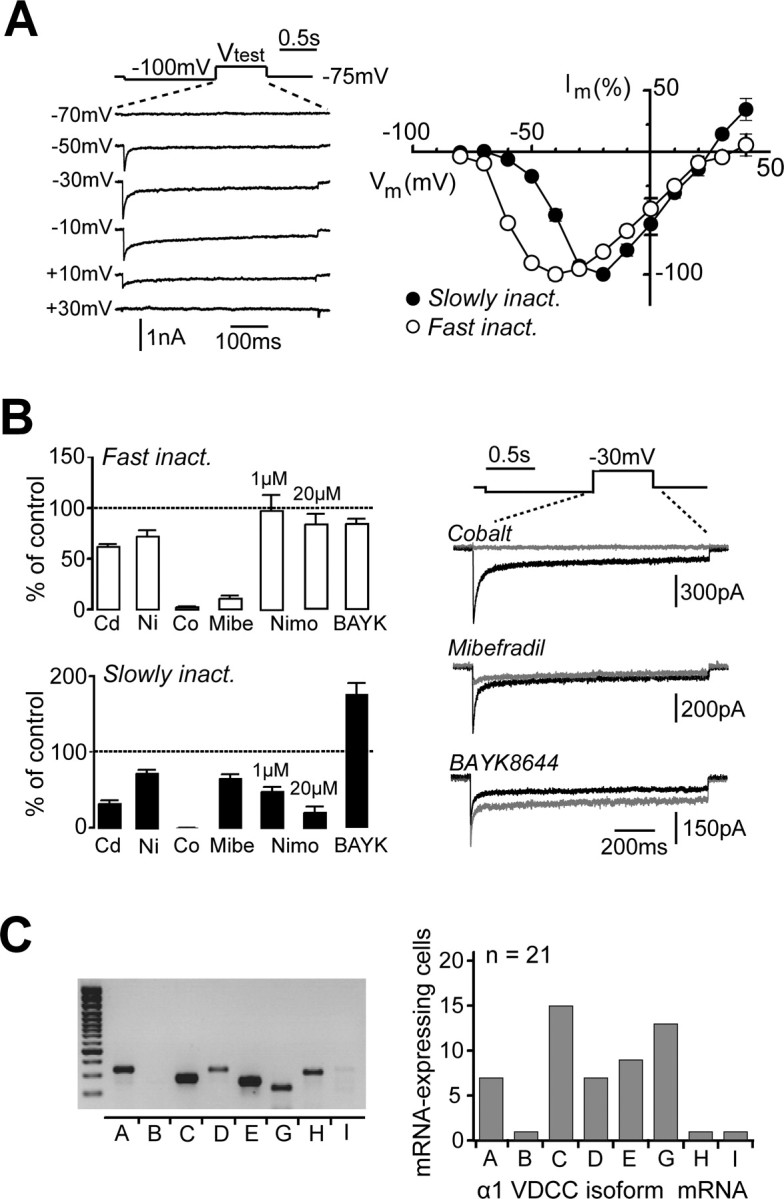
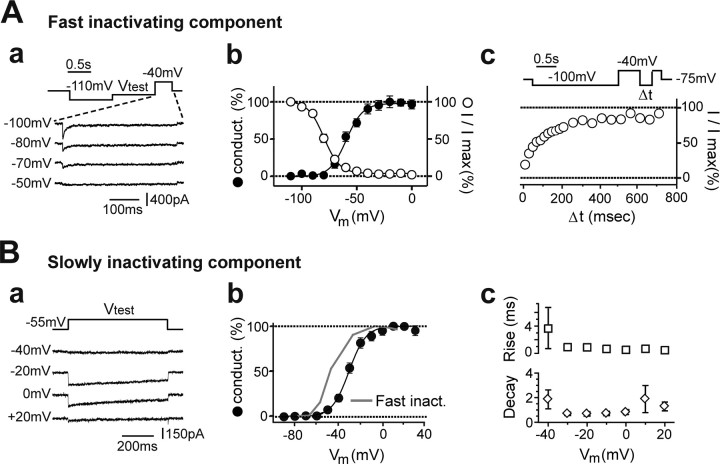
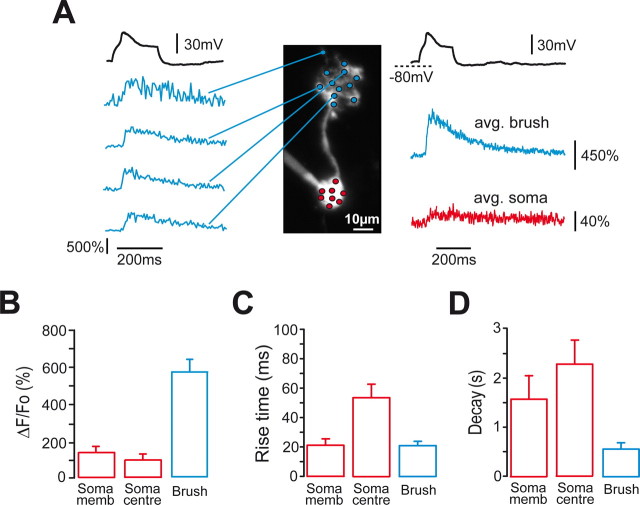
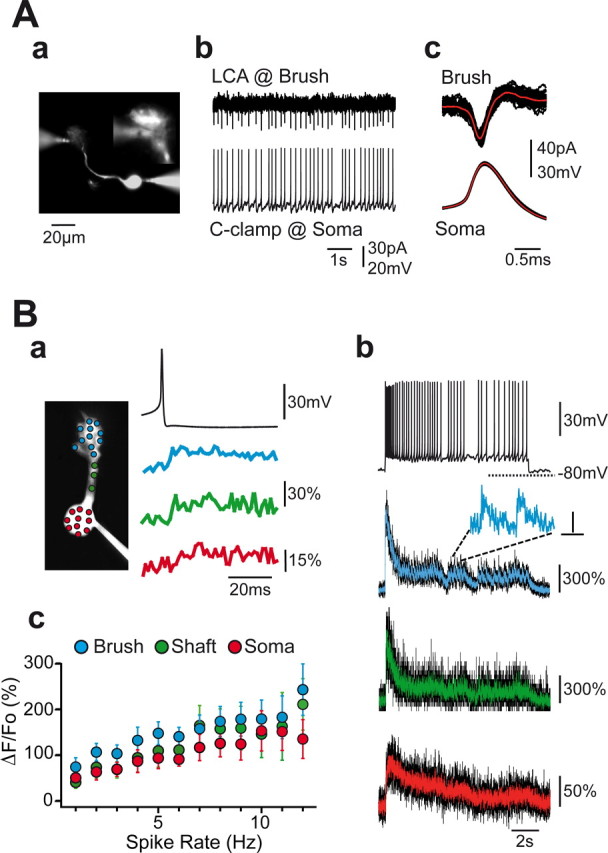
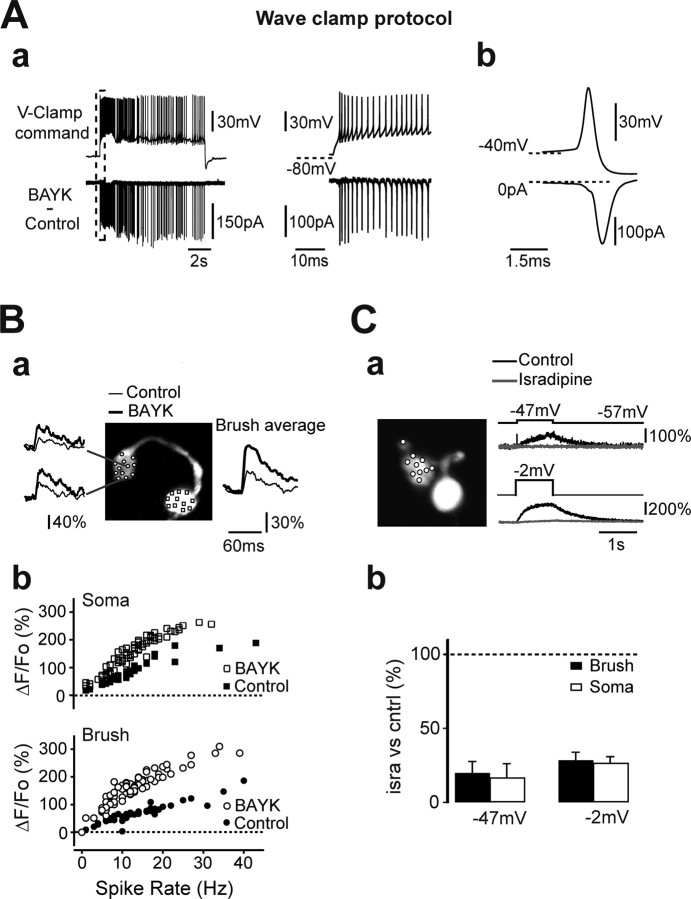
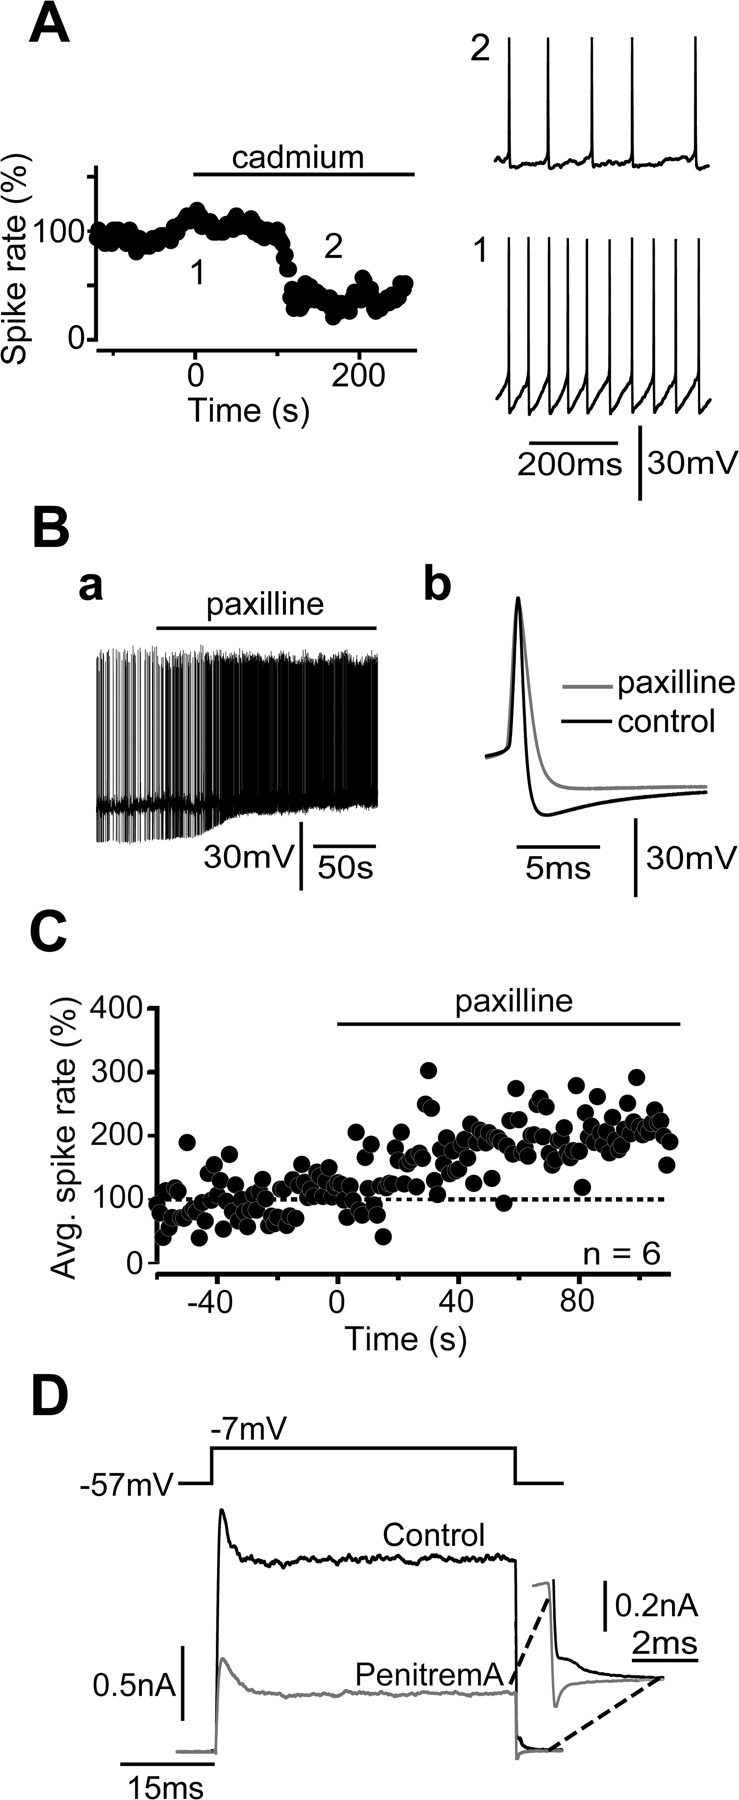
Cerebellar unipolar brush cells (UBCs) are glutamatergic interneurons that receive direct input from vestibular afferents in the form of a unique excitatory synapse on their dendritic brush. UBCs constitute independent relay lines for vestibular signals, and their inherent properties most likely determine how vestibular activity is encoded by the cerebellar cortex. We now demonstrate that UBCs are bimodal cells; they can either fire high-frequency bursts of action potentials when stimulated from hyperpolarized potentials or discharge tonically during sustained depolarizations. The two functional states can be triggered by physiological-like activity of the excitatory input and are encoded by distinct Ca2+-signaling systems. By combining complementary strategies, consisting of molecular and electrophysiological analysis and of ultrafast acousto-optical deflector-based two-photon imaging, we unraveled the identity and the subcellular localization of the Ca2+ conductances activating in each mode. Fast inactivating T-type Ca2+ channels produce low-threshold spikes, which trigger the high-frequency bursts and generate powerful Ca2+ transients in the brush and, to a much lesser extent, in the soma. The tonic firing mode is encoded by a signalization system principally composed of L-type channels. Ca2+ influx during tonic firing produces a linear representation of the spike rate of the cell in the form of a widespread and sustained Ca2+ concentration increase and regulates cellular excitability via BK potassium channels. The bimodal firing pattern of UBCs may underlie different coding strategies of the vestibular input by the cerebellum, thus likely increasing the computational power of this structure.


Figures

Figure 1.
Figure 1.
Mossy fiber stimulation and UBC excitability. A, The typical morphology of a cerebellar UBC shown here on the left was obtained with a commercial anti-calretinin antibody. Note the single dendrite terminating with small finger-like dendrioles. The histogram on the right illustrates the distribution of the resting membrane potentials (Rest. potential) of 20 UBCs, calculated as the membrane potential while injecting no net current into current-clamped cells. In only one case, a UBC fired spontaneously (Spontan. firing). Bins in the graph cover 2 mV intervals. B, In the voltage-clamp configuration, single mf stimulation produced the typical biphasic synaptic response of UBCs. The faster component is included in the dashed box on the left, and is correspondingly time enlarged on the right. Here, the stimulation artifact was cancelled for clarity, and the time of stimulation is indicated by the black arrow. Note the different time scale. In this UBC, the faster EPSC had 76.4 pA amplitude, 269 μs rise time, and 1.9 ms decay time constant. In contrast, the slower component had 58.0 pA amplitude and 454.5 ms decay time constant. The mf response was blocked by application of NBQX and d-APV (left gray trace). Traces are averages from eight (control) and 10 (NBQX and d-APV) individual responses. C, Mossy fiber stimulation induces bursts and tonic firing in UBCs. In current clamp, a train of six stimulations at 20 Hz triggered two bursts of action potentials in this UBC from hyperpolarized voltages (top). Longer stimulation trains (2 s at 20 Hz) induced two bursts followed by individual action potentials from a membrane potential slightly more depolarized than −70 mV (middle) and a train of tonic spikes, but no bursts, from more positive potentials (bottom). In all traces, bursts are indicated with black dots. A minimum of two action potentials at frequencies higher than 100 Hz were considered as a burst. Insets represent the first burst of action potentials on the top and the response of the cell to the first mf stimulation in the middle and bottom traces. Calibration: (inset) 30 mV, 5 ms. Stimulation artifacts have been reduced digitally for clarity.
Figure 2.
Figure 2.
The bimodal spiking activity of vestibulocerebellar UBCs is intrinsically determined. A, Example of a current-clamped UBC showing two different voltage-dependent firing modes induced by depolarizing pulses. From hyperpolarized membrane potentials, this cell fired a burst of seven sodium action potentials at a maximum instantaneous frequency of 417 Hz (inset, left trace), riding on a slow depolarizing wave that inactivated in a few tens of milliseconds. From depolarized potentials (right trace), the cell responded to the same positive current pulse by firing tonically, on average at 96 Hz. The dashed lines show reference membrane potentials for the two cases. Calibration: (inset) 10 ms, 40 mV. B, Mibefradil eliminates the bursting behavior of UBCs. In the experiment shown here, control depolarizing current pulses produced a high-frequency burst of action potentials followed by an accommodating spiking pattern. After application of mibefradil, increasing pulses (here from bottom to top) triggered either no spikes or an accommodating pattern at low frequencies but never bursts. C, LTSs in current-clamped UBCs. TTX was present in the bath in all experiments. Application of mibefradil (MIBE) completely blocked the occurrence of LTSs, as illustrated for one experiment by the traces on the left. LTS pharmacology is shown in the right graph. Mibefradil and replacement of extracellular calcium with magnesium (no Ca) decreased LTS amplitude (ampl.) almost completely. In contrast, bath application of cadmium (Cd) reduced LTS only partially. LTS amplitude was calculated as the difference between the membrane potential at the peak, and the potential at the end of the 500-ms-long depolarizing pulses. Cntrl, Control. D, Wave-clamp experiments revealed the activation of a low-threshold calcium current and of faster calcium currents concomitantly with LTSs and sodium action potentials, respectively. The traces correspond, from top to bottom, to the command template applied in voltage-clamp conditions in this experiment, to the corresponding current recorded in extracellular TEA-BBS and extracellular calcium (ext. Ca), to the current recorded in TEA-BBS with cobalt replacing calcium (ext. Co), and finally to the subtraction of the two previous traces. The thick bottom traces thus represent the net calcium currents activating during the protocol. Part of the left traces (dashed box) were expanded for better visualization on the right. In the extracellular cobalt trace, note the presence of an outward current activating during the part of the command template corresponding to sodium spikes. This current is likely mediated by potassium conductances not completely blocked by extracellular TEA-BBS.
Figure 3.
Figure 3.
Identification of VDCCs in UBCs. A, The average I–V curves for the FINC component (Fast inact.; right, open circles) and for the SLINC component (Slowly inact.; right filled circles) from several cells are depicted. I–V curves were obtained by stepping the membrane potential of UBCs to Vtest for 550 ms after a 1-s-long deinactivating pulse to −100 mV. Sweep extracts from the I–V curve of one cell are illustrated on the left. Test potentials are indicated at the left of the corresponding sweeps. In this cell, the peak FINC was 890 pA at −30 mV, whereas the peak SLINC was 231 pA at −20 mV. Note the different dependence on the membrane potential of the two VDCC components. B, Bar graphs summarizing the results of the pharmacological analysis of FINC (top graph) and SLINC (bottom graph) in voltage-clamped UBCs. On the right, traces from three distinct UBCs illustrating the typical effect of replacing external calcium with cobalt (top traces), of bath application of mibefradil (middle traces), and BAYK8644 (bottom traces) are shown. Control traces are black, and traces recorded during drug application are gray. Note that cobalt completely inhibited both components (FINC, 3.4% of control; SLINC, 1.1%), whereas mibefradil strongly reduced FINC (12.8%) and, to a lesser extent, SLINC (75.3%). Finally, BAYK8644 potentiated SLINC (167.0%) while modifying FINC only slightly (118.2%). Cd, Cadmium; Ni, nickel; Co, cobalt; Mibe, mibefradil; Nimo, nimodipine; BAYK, BAYK8644. C, Single-cell RT-PCR testing the expression of VDCC mRNAs in UBCs. Left, Expression pattern for one UBC. In this case, the mRNAs of several VDCCs were amplified and revealed. Exceptions were the mRNAs of the α1B subunit-containing N-type channel and the α1I subunit-containing T-type channel. The first column on the left corresponds to molecular weight markers. Right, Bar graphs representing the number of UBCs, of a total of 21, in which the mRNAs of the indicated α1 subunits were revealed.
Figure 4.
Figure 4.
A, FINC activation and inactivation properties. Aa, Sample traces of the two pulse protocols used to study FINC inactivation. After the deinactivating pulse, T-type currents were inactivated by stepping the membrane potential to Vtest for 1 s. The resulting steady-state inactivation was then studied by maximally activating T-type channels at −40 mV. Percentage current inactivation (open circles, Ab) and conductance (conduct.) activation (filled circles, Ab) curves are illustrated as a function of the membrane potential. Note the wide crossing area formed by the two curves. The recovery time from inactivation is illustrated in Ac. At the top, the protocol used is shown. After the deinactivating pulse to −100 mV, FINC was completely inactivated by a 500-ms-long step to −40 mV. After a variable time interval Δt at −100 mV, recovery was tested again at −40 mV. B, SLINC kinetic properties. Ba, Sample traces of the SLINC currents obtained at Vtest, indicated at the left side of the sweeps. Here, no deinactivating prepulse was given. Bb, Percentage conductance activation is illustrated (black circles). For comparison, the activation curve of FINC is also depicted (gray line). B, The dependence of SLINC rise times (top graph) and decay times (bottom graph) on the membrane potential is shown.
Figure 5.
Figure 5.
Two-photon imaging analysis of LTS-induced Ca2+ transients in UBCs. A, The morphology of the UBC examined in this experiment was reconstructed by superposing several Alexa 594 fluorescence images taken at different focal planes. TTX was present in the bath. Fluorescence from multiple POIs from both the brush (blue circles) and the soma (red circles) was simultaneously recorded. In this experiment, POI fluorescence was sampled every 1.35 ms. On the left, the Ca2+ transients induced by a single LTS (black trace on top) are shown for the brush POIs indicated by the blue lines. Note the uniformity of transient amplitude and kinetics in all of the POIs shown. On the right, the Ca2+ transients obtained by averaging all of the POIs analyzed in the brush (blue trace; avg. brush) and in the soma (red trace; avg. soma) are depicted for the same trial. Note the different amplitude in the two compartments. In this cell, ΔF/F0 after a single LTS was 660.8 ± 21.3% in the brush (n = 12 POIs; average of 4 LTS responses), 40.5 ± 2.8% in the membrane somatic region (soma memb) (n = 6 POIs), and 21.5 ± 2.5% in the somatic bulk (n = 2 POIs). Average ΔF/F0 values, 20–80% rise times, and decay time constants from all experiments are depicted in B, C, and D.
Figure 6.
Figure 6.
Brush excitability and Ca2+ signals in tonically firing UBCs. A, Simultaneous somatic current clamp (C-clamp) and brush LCA recordings were performed from single UBCs. One experiment is illustrated in Aa, where the morphology of the cell and the recording pipettes are shown. The inset image on the top right corner shows in more detail the contact point between the LCA pipette and the brush at a different focal plane. Here, a standard CCD camera collected the fluorescence originating from the Alexa 488-containing pipette solutions. In this UBC, the distance between the brush and the soma center was ∼50 μm. Tonic firing triggered by somatic current injection invariably induced fast signals in the LCA pipette (Ab). These resembled “classical” cell-attached action potentials. Several somatic action potentials and time-locked brush LCA traces (black traces) are illustrated in Ac with their averages (red traces; n = 56 individual sweeps). Single traces were aligned at the peak of somatic spikes. B, Two-photon imaging analysis of Ca2+ transients in tonically firing UBCs. In the experiment illustrated here, the depolarizing pulse was provided from hyperpolarized membrane potentials, such that the tonic firing period was preceded by an initial burst (Bb, black top trace). Note the huge fluorescence transient in correspondence with the spike burst in the brush (Bb, second trace from top) and the dendritic shaft (third trace) and the much smaller one in the soma (fourth trace). Single spike-induced Ca2+ augmentations during tonic firing could be easily detected in the brush after inspection of the trace, as shown at enlarged time scale in the inset by the transients corresponding to two consecutive spikes. In contrast, fast signals were revealed in the shaft and soma only after averaging several single action potential-locked fluorescence sweeps (n = 35; Ba). In this experiment, Ca2+ transients associated with tonic firing in the soma were, atypically, much smaller than in the brush and the shaft. Colored fluorescence traces in Bb are a smoothed version of the raw recordings, which are illustrated in black. POI fluorescence was sampled every 1.404 ms in this experiment. Inset bars are 75% and 20 ms. In Bc, the average ΔF/F0 as a function of the firing frequency is illustrated for all cellular compartments. Color codes are always blue for the brush, green for the shaft, and red for the soma.
Figure 7.
Figure 7.
L-type channels mediate most of the somatodendritic Ca2+ influx during tonic firing. A, In this wave-clamp experiment, the voltage command template used is represented by the top traces in Aa. It consisted of a mixed bursting and tonic firing pattern of activity, which was previously recorded in the same UBC. The bottom traces show the currents activated by BAYK8644 (BAYK) during the voltage-clamp protocol. Note that the BAYK8644-sensitive currents reliably activated in correspondence with each imposed spike. The sweep extracts included in the dashed box on the left are shown at higher temporal resolution on the right. In Ab, the average of 50 single action potential commands (top trace), extracted from the traces illustrated in Aa, are shown with the corresponding BAYK8644-sensitive currents (bottom trace). The traces were time-locked at the peak of the spike command. Note the rapidity of current activation and deactivation kinetics and its weak activation during the slow depolarizing phase preceding the spike initiation and during the spike upstroke. B, Two-photon imaging analysis confirmed that L-type channels are present in the somatodendritic compartment of UBCs. The reconstructed morphology of the cell is shown in the top panel. Exemplary fluorescence traces before and after BAYK8644 (BAYK) application for the indicated POIs are also depicted. Each trace is an average of 30 action potential-induced transients. As shown in the bottom graphs, BAYK8644 application increased the slope of the linear dependence of ΔF/F0 on the spike rate both in the soma (top graph) and in the brush (bottom graph). Fluorescence values in the soma and the brush were calculated from the average fluorescence traces obtained by pooling all somatic and brush POIs, respectively. POI positions are indicated by the symbols in the morphological reconstruction (brush, circles; soma, squares). In this experiment, fluorescence from each POI was sampled every 1.134 ms. C, The effect of isradipine (isra) on Ca2+ transients induced by 1-s-long depolarizing steps to UBCs was examined. TTX was present in the bath. In this UBC, two-photon imaging analysis was performed only for the brush POIs shown in the morphological reconstruction of the cell. Isradipine reduced the amplitude of ΔF/F0 from 34.4 and 199.4% in the control (cntrl) to 1.6 and 8.2% for voltage steps from −57 to −47 and −2 mV, respectively. Average values in the soma and the brush from all experiments are shown in the graphs below for the same voltage steps.
Figure 8.
Figure 8.
VDCCs shape UBC excitability during tonic firing. A, Cadmium (50 μm) dramatically modifies the excitability properties of UBCs. In the experiment shown here, application of cadmium reduced the spike rate from 18.0 to 7.2 Hz, with concomitant reduction of the spike amplitude (from 52.7 to 47.7 mV) and the maximal AHP (from 17.5 to 6.9 mV) and increase of the spike FDHM (from 695 to 921 μs). Sample sweeps from the control (1) and the test (2) periods are shown on the right. In the graph on the left, spike rates were averaged in 1-s-long bins. The reduction of the AHP strongly suggests that Ca2+-dependent potassium conductances are activated by single spikes. This effect on the AHP was reliably induced by cadmium in most cells, whereas the reduction of the spike rate was noticed in only 50% of the tested UBCs. In the remaining group, the spike rate increased. B, BK potassium channel activation in tonically firing UBCs. In Aa, an extract of the continuous recording of a tonically firing UBC before and during paxilline application is shown. Both the decrease of maximal AHP (from 25.5 to 14.1 mV) and the dramatic increase of the firing frequency (from 1.6 to 8.1 Hz) are evident. Similar results were obtained in the case of another UBC, which is depicted in Ab by the superposition of average action potential traces in the control (black) and after paxilline application (gray; both traces are averages of 26 sweeps). In this cell, the spike rate increased from 4.7 to 6.4 Hz, and the spike FDHM augmented from 0.54 to 0.99 ms, whereas the AHP amplitude decreased from 26.8 to 16.6 mV. The AHP amplitude was calculated as the membrane potential difference between the spike threshold and the following maximal hyperpolarization. C, The graph depicts the increase of the firing frequency with time after paxilline application. Spike frequencies in 1-s-long bins were calculated for each experiment, considering paxilline application as t = 0. Corresponding bins from five experiments were then averaged and shown here as a function of time. Error bars were omitted for clarity. D, Voltage-clamp quantification of the amount of BK current present in UBCs. The effect of the BK channel blocker penitrem A was studied on the outward current produced by depolarizing UBCs from −57 to −7 mV. In this case, penitrem A reduced the outward current by 943.1 pA. Note the decrease of the current during the repolarizing phase, as shown in the inset on the right. Avg., Average.

References

    1. Altman J, Bayer SA. Time of origin and distribution of a new cell type in the rat cerebellar cortex. Exp Brain Res. 1977;29:265–274. - PubMed
    1. Avery RB, Johnston D. Multiple channel types contribute to the low-voltage-activated Ca2+ current in hippocampal CA3 pyramidal neurons. J Neurosci. 1996;16:5567–5582. - PMC - PubMed
    1. Bading H, Ginty DD, Greenberg ME. Regulation of gene expression in hippocampal neurons by distinct calcium signaling pathways. Science. 1993;260:181–186. - PubMed
    1. Barbour B, Isope P. Combining loose cell-attached stimulation and recording. J Neurosci Methods. 2000;103:199–208. - PubMed
    1. Barmack NH. Central vestibular system: vestibular nuclei and posterior cerebellum. Brain Res Bull. 2003;60:511–541. - PubMed

Publication types

Substances

LinkOut - more resources