Comparative Study
. 2007 Apr 4;27(14):3839-44.
doi: 10.1523/JNEUROSCI.4636-06.2007.

Brain oscillations control timing of single-neuron activity in humans

Affiliations
Comparative Study

Brain oscillations control timing of single-neuron activity in humans

Joshua Jacobs et al. J Neurosci. .

Abstract

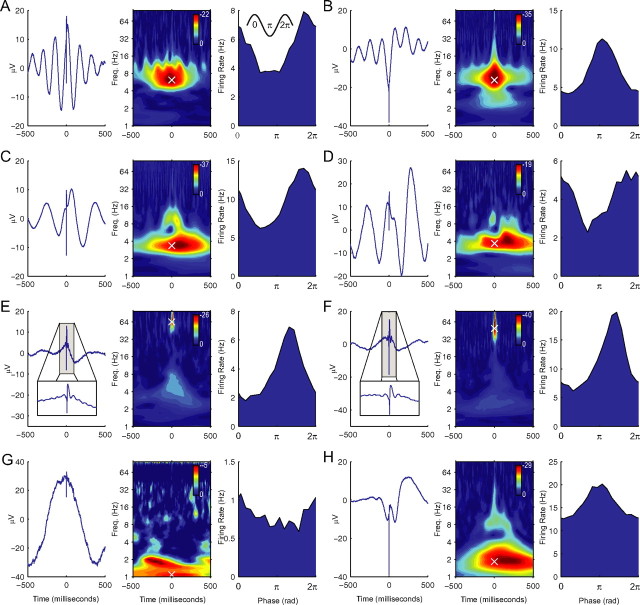
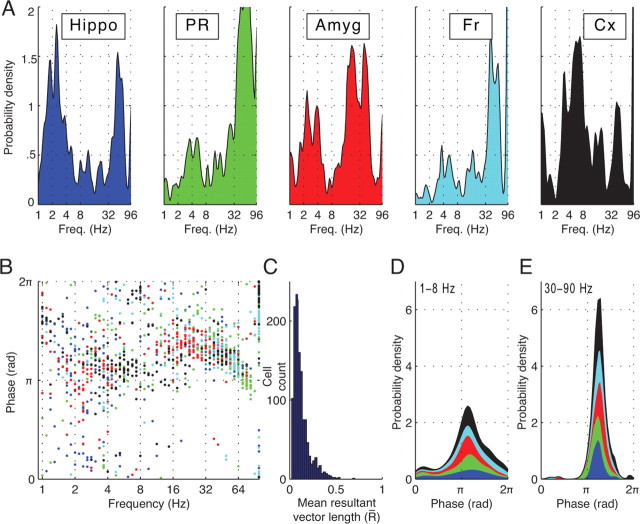
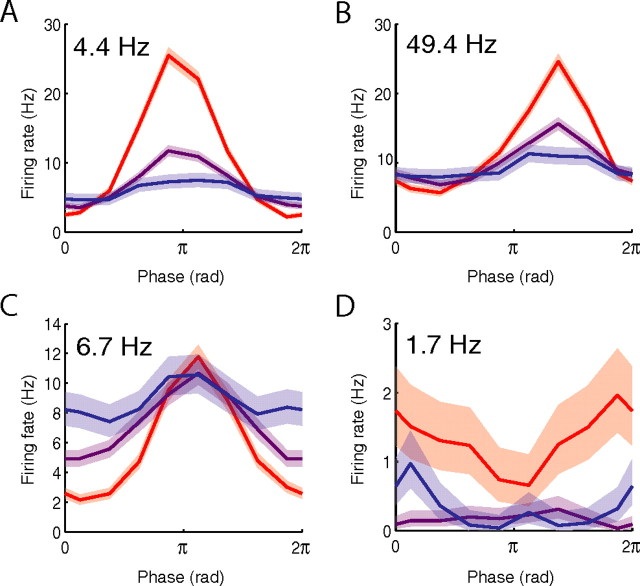
A growing body of animal research suggests that neurons represent information not only in terms of their firing rates but also by varying the timing of spikes relative to neuronal oscillations. Although researchers have argued that this temporal coding is critical in human memory and perception, no supporting data from humans have been reported. This study provides the first analysis of the temporal relationship between brain oscillations and single-neuron activity in humans. Recording from 1924 neurons, we find that neuronal activity in various brain regions increases at specific phases of brain oscillations. Neurons in widespread brain regions were phase locked to oscillations in the theta- (4-8 Hz) and gamma- (30-90 Hz) frequency bands. In hippocampus, phase locking was prevalent in the delta- (1-4 Hz) and gamma-frequency bands. Individual neurons were phase locked to various phases of theta and delta oscillations, but they only were active at the trough of gamma oscillations. These findings provide support for the temporal-coding hypothesis in humans. Specifically, they indicate that theta and delta oscillations facilitate phase coding and that gamma oscillations help to decode combinations of simultaneously active neurons.


Figures

Figure 1.
Figure 1.
A, Activity of a neuron from subject 2's right superior temporal gyrus, which was phase locked to the peak of 7.3 Hz theta oscillations. Left, Spike-triggered LFP average. Spike onset occurred at 0 ms. Middle, Z score from Rayleigh test evaluating the hypothesis of a uniform LFP phase distribution at the moment of spike onset. Shifts along the horizontal axis indicate the relation between spiking and phase of time-shifted LFP oscillations. The white × symbol indicates the frequency at which phase locking at 0 ms is most statistically significant. Right, Firing rate as a function of phase at 7.3 Hz (the frequency marked by the × in middle panel). The circular mean resultant vector length (Fisher, 1993) of this 7.3 Hz LFP phase distribution is 0.19. The inset example waveform is a reminder that the phases of the peak and trough of an oscillation are 0 (or 2π) radians and π radians, respectively. B, Activity of a neuron from subject 1's right temporal gyrus that was phase locked to the trough of 6.2 Hz theta oscillations ( = 0.24). C, Behavior of a neuron from subject 20's left entorhinal cortex, which was primarily phase locked to 3.4 Hz oscillations ( = 0.2), but also exhibited some phase locking to oscillations at 9.5 Hz. D, A neuron from subject 18's right orbitofrontal cortex, which was phase locked to 3.7 Hz oscillations ( = 0.17). E, Behavior of a neuron from subject 4's left posterior hippocampus that was phase locked to the trough of 70 Hz gamma oscillations ( = 0.17). Inset in left panel depicts a zoomed plot of the spike-triggered average of this neuron. F, Behavior of a neuron from subject 12's left anterior hippocampus that exhibited phase-locked spiking near the trough of 49 Hz gamma oscillations ( = 0.2). G, The activity of a neuron from subject 1's left anterior hippocampus, which was phase locked to the peak of 1.1 Hz oscillations ( = 0.1). H, Activity of a neuron from the left amygdala of subject 3 that was phase locked to oscillations primarily at 1.8 Hz ( = 0.11), but also at 9.5 Hz.
Figure 2.
Figure 2.
A, Probability of a neuron exhibiting significant phase locking as a function of frequency (Freq.), grouped by region. Hippo, Hippocampus; PR, parahippocampal region; Amyg, amygdala; Fr, frontal region; Cx, temporal and parietal cortices. See Materials and Methods for phase-locking criteria. Total area under each curve indicates the fraction of neurons in each region that were phase locked (63, 70, 67, 49, and 72%, in hippocampus, parahippocampal region, amygdala, frontal region, and temporal and parietal cortices, respectively). Each curve is smoothed with a Gaussian kernel. B, Distribution of preferred phases (i.e., the phase in which firing rate was highest) of all 1215 phase-locked neurons. The region of each neuron is indicated using color scheme from A. C, Histogram of the circular mean resultant vector length () (Fisher, 1993) of each phase-locked neuron. D, Preferred-phase probability density for all neurons that were phase locked at delta or theta frequencies (1–8 Hz). Coloring within each curve indicates the preferred-phase distributions of neurons in different regions. E, Preferred-phase probability density for all neurons that were phase locked to gamma oscillations (30– 90 Hz).
Figure 3.
Figure 3.
Relationship between oscillatory power and firing rates of phase-locked neurons. A, Activity of a neuron from subject 5's left parietal cortex that exhibited maximal phase locking at 4.4 Hz. Red, purple, and blue lines indicate firing rates during high, medium, and low oscillatory power, respectively (for details, see Materials and Methods). The shaded area indicates 95% confidence intervals based on the binomial distribution. B, Activity of a neuron from subject 12's left anterior hippocampus (same neuron as Fig. 1F) that was phase locked to LFP oscillations at 49 Hz. C, Activity of a neuron from subject 1's right superior temporal gyrus (same neuron as Fig. 1A). D, Activity of a neuron from subject 18's left anterior hippocampus.

Similar articles

Cited by

References

    1. Berry SD, Thompson RF. Prediction of learning rate from the hippocampal electroencephalogram. Science. 1978;200:1298–1300. - PubMed
    1. Bódizs R, Kántor S, Szabó G, Szũcs A, Erõss L, Halász P. Rhythmic hippocampal slow oscillation characterizes REM sleep in humans. Hippocampus. 2001:747–753. - PubMed
    1. Bragin A, Jando G, Nadasdy Z, Hetke J, Wise K, Buzsaki G. Gamma (40–100 Hz) oscillation in the hippocampus of the behaving rat. J Neurosci. 1995;15:47–60. - PMC - PubMed
    1. Buzsáki G. Theta oscillations in the hippocampus. Neuron. 2002;33:325–340. - PubMed
    1. Buzsáki G. Theta rhythm of navigation: link between path integration and landmark navigation, episodic and semantic memory. Hippocampus. 2005;15:827–840. - PubMed

Publication types