. 2007 Jun;4(2):130-45.
doi: 10.1088/1741-2560/4/2/013. Epub 2007 Apr 4.

Trophic factor induction of human umbilical cord blood cells in vitro and in vivo

Affiliations

Trophic factor induction of human umbilical cord blood cells in vitro and in vivo

Ning Chen et al. J Neural Eng. 2007 Jun.

Abstract

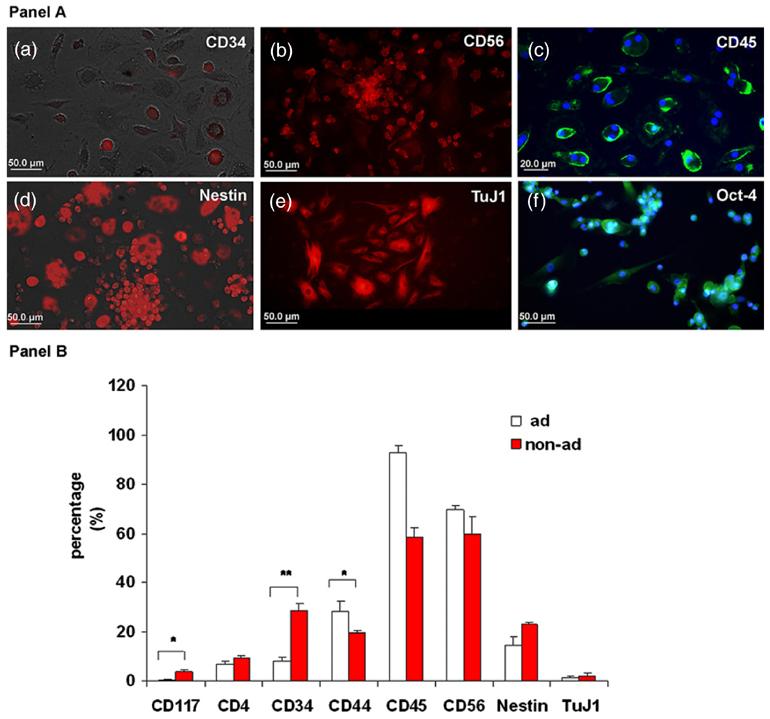
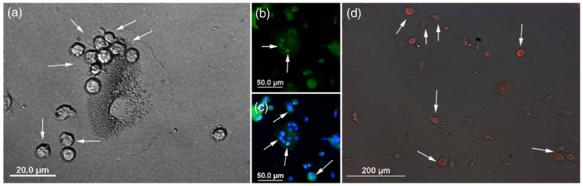
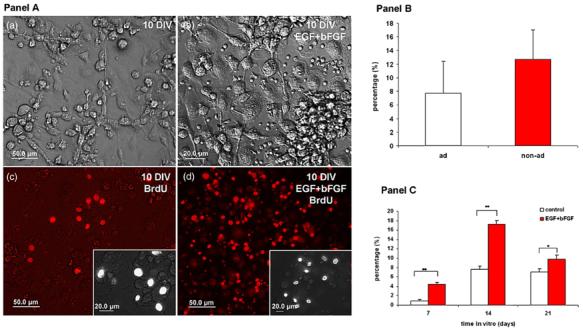
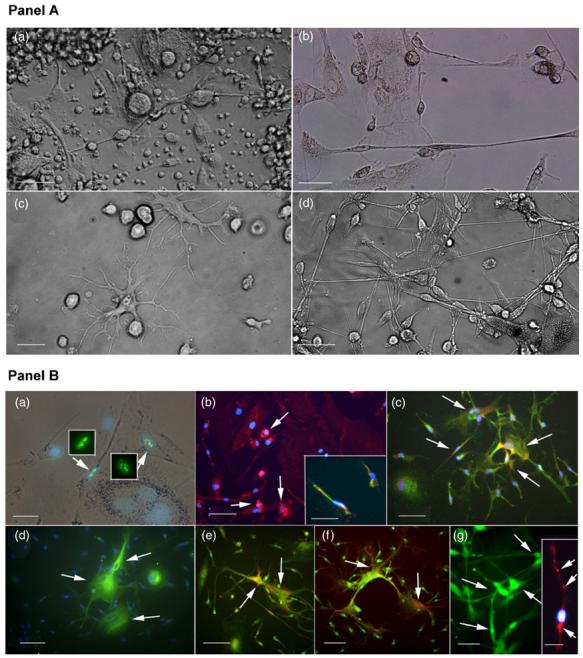
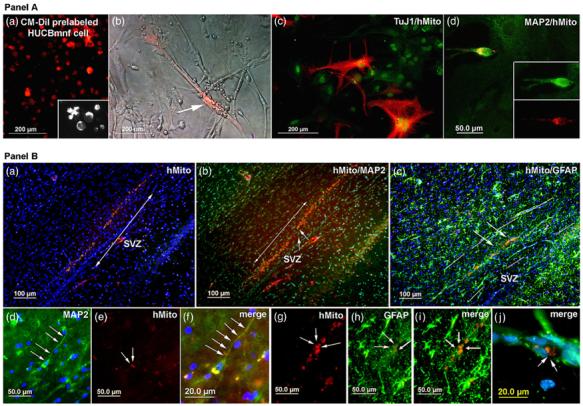
The mononuclear fraction of human umbilical cord blood (HUCBmnf) is a mixed cell population that multiple research groups have shown contains cells that can express neural proteins. In these studies, we have examined the ability of the HUCBmnf to express neural antigens after in vitro exposure to defined media supplemented with a cocktail of growth and neurotrophic factors. It is our hypothesis that by treating the HUCBmnf with these developmentally-relevant factors, we can expand the population, enhance the expression of neural antigens and increase cell survival upon transplantation. Prior to growth factor treatment in culture, expression of stem cell antigens is greater in the non-adherent HUCBmnf cells compared to the adherent cells (p < 0.05). Furthermore, treatment of the non-adherent cells with growth factors, increases BrdU incorporation, especially after 14 days in vitro (DIV). In HUCBmnf-embryonic mouse striata co-culture, a small number of growth factor treated HUCBmnf cells were able to integrate into the growing neural network and express immature (nestin and TuJ1) and mature (GFAP and MAP2) neural markers. Treated HUCBmnf cells implanted in the subventricular zone predominantly expressed GFAP although some grafted HUCBmnf cells were MAP2 positive. While short-term treatment of HUCBmnf cells with growth and neurotrophic factors enhanced proliferative capacity in vitro and survival of the cells in vivo, the treatment regimen employed was not enough to ensure long-term survival of HUCBmnf-derived neurons necessary for cell replacement therapies for neurodegenerative diseases.


Figures

Figure 1
Figure 1
Expression of immature hematopoietic and neural antigens in the HUCBmnf non-adherent fraction. Panel A: representative photomicrographs of replated non-adherent HUCBmnf cells that express immature hematopoietic and non-hematopoietic markers after 14 DIV. (a) 29 ± 3% of CD34 positive (+) small round cells (red) were found. In addition, many CD56 (NCAM) immunoreactive cells were also found (b). (c) While 58 ± 5% of the non-adherent cells still expressed common leukocyte antigen CD45 (green), 93 3% of the adherent HUCBmnf cells were positive for CD45, suggesting that they maintained their hematopoietic heritage. A number of cells in the non-adherent HUCBmnf were negative for this antigen. (d) The immature neural marker, nestin, (red) as well as early neuronal marker TuJ1 ((e), red) were expressed. (f) The majority of the replated non-adherent HUCBmnf cells (93 ± 6%) were immunopositive for the stem cell marker Oct-4 (green). DAPI (blue) counterstaining was used to visualize all nucleated cells in the culture. Scale bar = 50 μm (a), (b), (d), (e) and (f), and 20 μm in (c). Panel B: after 14 DIV, the expression of immature hematopoietic markers (CD117 and CD34) and the neural marker, nestin, was greater in the non-adherent HUCBmnf cells compared to the adherent cells while the hematopoietic markers (CD45 and CD56) were predominantly found in adherent cells. Significant differences between the two groups were assessed by Student's t-test (*p < 0.05, **p < 0.001).
Figure 2
Figure 2
HUCBmnf cells in the non-adherent fraction express an early stem cell antigen. (a) A brightfield photomicrograph showing the small, round non-adherent HUCBmnf cells (arrows) sitting on the larger, adherent egg-like cells after 8 DIV. (b) and (c) Fluorescent photomicrographs indicated that these small, round cells expressed Oct-4 (green, arrows), while the bigger egg-like adherent cell was negative for Oct-4. DAPI (blue) was used to visualize cell nuclei. (d) The floating fraction from the identical HUCBmnf culture contained mostly Oct-4 positive, undifferentiated cells (red, arrows) shortly after replating for 1 DIV in DMEM with serum. Scale bar = 20 μm in (a); 50 μm in (b) and (c); 200 μm in (d).
Figure 3
Figure 3
Proliferative capacity of non-adherent HUCBmnf after 10 DIV with or without growth factors. Panel A: (a) brightfield photomicrograph of HUCBmnf cultured for 10 DIV without growth factors. The culture in (b) was treated with hEGF and hbFGF. BrdU+ cells were found in both the non-treated (c) and growth factor treated (d) cultures. The insets in (c) and (d) show BrdU labeled cells at higher magnification. Scale bar = 50 μm in (a)-(d), and 20 μm in inset of (c) and (d). Panel B: the proliferative capacity of the non-adherent cells tended to be greater than in the adherent HUCBmnf cells at 14 DIV (p = 0.06). Panel C: within the nonadherent fraction, treatment of the cultures with growth factors increased BrdU incorporation into the cells. Significant differences between the two groups were assessed by Student's t-test (*p < 0.05, **p < 0.001).
Figure 4
Figure 4
Telomerase activity in adherent and non-adherent HUCBmnf cells before and after treatment of growth factors. (a) Telomerase activity in relative absorbance units of all samples (black column) and their negative controls (heat-treated samples; white column). Sample 1 (SPL1) and sample 2 (SPL2)-adherent HUCBmnf cells (14 DIV) with or without growth factors treatment; sample 3 (SPL3) and sample 4 (SPL4)-adherent HUCBmnf cells (30 DIV) with or without growth factor treatment; sample 5 (SPL5) and sample 6 (SPL6)-non-adherent HUCBmnf cells (14 DIV) with or without growth factors treatment; sample 7 (SPL7) and sample 8 (SPL8)-nonadherent HUCBmnf cells (30 DIV) with or without growth factors treatment. CTL—telomerase positive control. (b) Telomerase activity standardized for activity in the heat-treated samples. Only ΔA values of SPL5 and CTL are more than 0.15.
Figure 5
Figure 5
Morphology and immunophenotypes of HUCBmnf non-adherent fraction exposed to growth factors and re-cultured with defined differentiation media. Panel A: (a) Brightfield photomicrograph of non-adherent HUCBmnf cells cultured for 1 DIV and then re-cultured in DM1 for up to14 days. These cells retained the heterogeneous morphologies seen in cultures of full HUCBmnf. (b) Cells that were cultured for 30 DIV prior to replate in DM1 for another 14 DIV, were bipolar with small cell bodies and had long thin processes that formed a network. The occasional large egg-shaped cell, usually found in the adherent fraction, was also noted. (c) When cells were cultured in GM for 14 DIV prior to culturing with DM1 for 14 DIV, the cells became larger with multiple dendrite-like processes. (d) When the HUCBmnf were pre-cultured for 40 DIV and then replated in DM2 for 14 DIV, the cell bodies had one or two long processes, interconnecting to form a network similar to (b). Scale bar = 50 μm in (a) and (b), 20 μm in (c) and (d). Panel B: immunophenotypes of cultured non-adherent HUCB mnf. When these cells were pre-cultured for 14 DIV in GM and then replated in DM1 for 14 DIV, (a) Ki67 labeled nuclei (green, arrows) were visible within well differentiated cells. The inset shows the same Ki67 labeled cells under fluorescent illumination. (b) CD45+ expression was still present in these cultures (arrows). Some of these cells co-expressed vimentin (inset; CD45: red and vimentin: green). (c) Mostofthe cells (85 ± 4%) expressed the glial marker, GFAP (green). A small number of cells (12 ± 6% in this culture co-expressed GFAP and immature neural marker, nestin (GFAP: green and nestin: red; arrows). (d) few TuJ1+ cells (1 ± 0.7%, green, arrows) were detected in the culture and some of these co-expressed GFAP (e) (TuJ1: red and GFAP: green, arrows). (f) MAP2+ cells (green, arrows) were found in the HUCBmnf cultures maintained in GM for 40 DIV and then re-cultured in DM2 for up to 14 DIV. Some cells cultured under this condition were positive for synaptophysin (inset, red, arrows). Blue counterstaining was done with nuclear DAPI (blue). Scale bar = 50 μm in (a), (g) and inset in (a) and (g); 100 μm in (b)-(f).
Figure 6
Figure 6
HUCBmnf non-adherent cells co-cultured with mouse embryonic striatal cells in vitro or grafted into rat brain. The HUCBmnf cells were cultured with growth factors for 40 DIV and then co-cultured with E14 mouse striata (ST). Panel A: (a) most cells (95%) were labeled by a CM-DiI cell tracer (red) before co-culture. The inset shows in greater detail CM-DiI pre-labeled cells at higher magnification (100 μm); (b) phase contrast/fluorescent photomicrograph showing a CM-DiI pre-labeled HUCBmnf cell surrounded by unlabeled mouse striatal cells. (c) Some cells (2%) co-expressed TuJ1 (red) and human mitochondrial antigen (green). (d) A few cells (1%) were positive for both MAP2 and human mitochondrial antigen (yellow). Panel B: photomicrograph of non-adherent HUCBmnf cells exposed to growth factors prior to transplantation into the SVZ of adult rats. (a) Fluorescent photomicrograph of sagittal brain section of a 9 month old rat showing surviving HUCBmnf cells within the SVZ to RMS. These cells were distributed around the injection site in a rat that survived 21 days post-transplantation. (b) The same photomicrograph as in panel A, but showing that some of the human mitochondrial labeled cells (red) within the RMS express MAP2 (green). (c) Some of these cells express both human mitochondrial antigen (red) and GFAP (green). (d) This is a higher magnification view of the area highlighted by small arrows in (b) in panel B. A MAP2+ cell with a long thin process (green; arrows) is clearly visible. (e) The same cell as in (d) is also labeled with human mitochondrial antibody (red). (f) A merged image of (d) and (e) with DAPI (blue) used to visualize the cell nuclei (g)-(j). Similarly, these images show GFAP+ /hMito+ (human mitochondria) cells within the needle tract in image (c) (arrows). Scale bar = 200 μm in (a)-(c) and 50 μm in panel A; 100 μm in (a)-(c) and 50 μmin (d), (e) and (g)-(i) and 20 μm in (f) and (j) in panel B.

Similar articles

Cited by

References

    1. Kim SY, Park SY, Kim JM, Kim JW, Kim MY, Yang JH, Kim JO, Choi KH, Kim SB, Ryu HM. Differentiation of endothelial cells from human umbilical cord blood AC133-CD14+ cells. Ann. Hematol. 2005;84:417–22. - PubMed
    1. Goodwin HS, Bicknese AR, Chien SN, Bogucki BD, Quinn CO, Wall DA. Multilineage differentiation activity by cells isolated from umbilical cord blood: expression of bone, fat, and neural markers. Biol. Blood Marrow Transplant. 2001;7:581–8. - PubMed
    1. Broxmeyer HE. Biology of cord blood cells and future prospects for enhanced clinical benefit. Cytotherapy. 2005;7:209–18. - PubMed
    1. Rosada C, Justesen J, Melsvik D, Ebbesen P, Kassem M. The human umbilical cord blood: a potential source for osteoblast progenitor cells. Calcif. Tissue Int. 2003;72:135–42. - PubMed
    1. Kong KY, Ren J, Kraus M, Finklestein SP, Brown RH., Jr Human umbilical cord blood cells differentiate into muscle in sjl muscular dystrophy mice. Stem Cells. 2004;22:981–93. - PubMed

Publication types

MeSH terms

Substances