. 2007 Apr 6;3(4):e54.
doi: 10.1371/journal.pgen.0030054.

Integration of light and temperature in the regulation of circadian gene expression in Drosophila

Affiliations

Integration of light and temperature in the regulation of circadian gene expression in Drosophila

Catharine E Boothroyd et al. PLoS Genet. .

Abstract

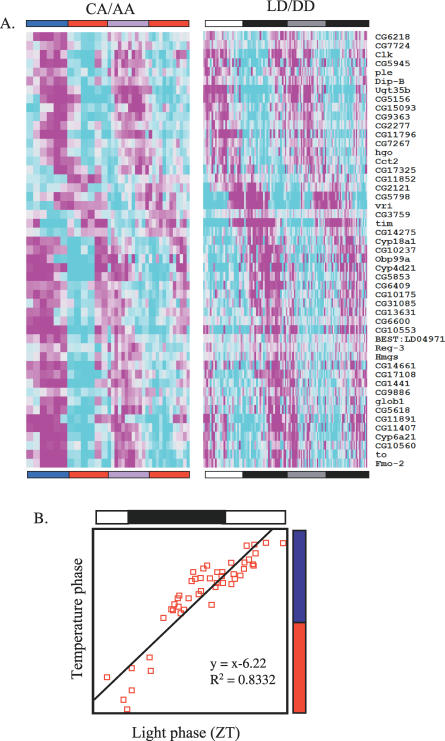
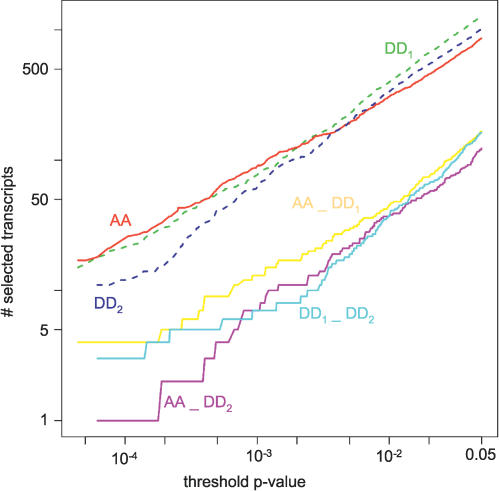
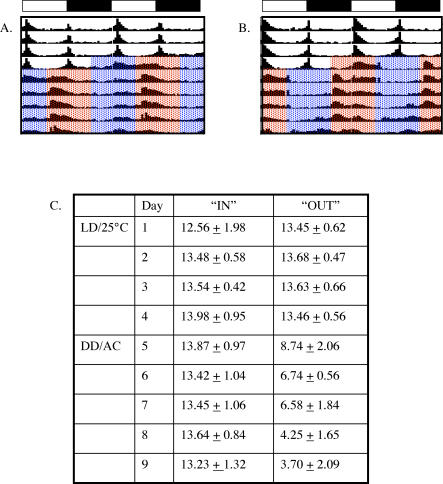
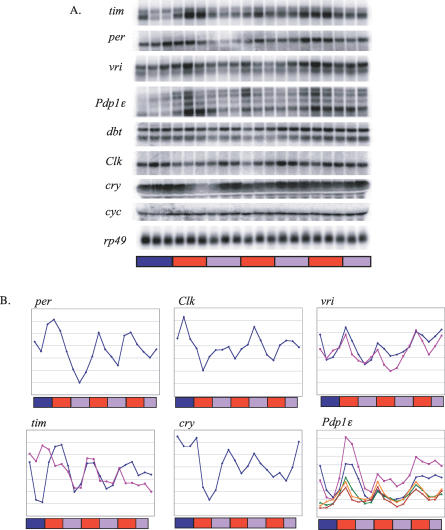
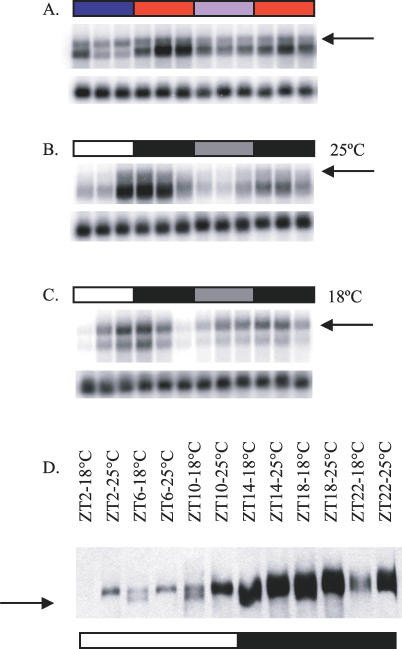
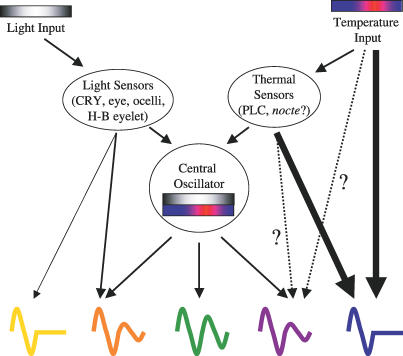
Circadian clocks are aligned to the environment via synchronizing signals, or Zeitgebers, such as daily light and temperature cycles, food availability, and social behavior. In this study, we found that genome-wide expression profiles from temperature-entrained flies show a dramatic difference in the presence or absence of a thermocycle. Whereas transcript levels appear to be modified broadly by changes in temperature, there is a specific set of temperature-entrained circadian mRNA profiles that continue to oscillate in constant conditions. There are marked differences in the biological functions represented by temperature-driven or circadian regulation. The set of temperature-entrained circadian transcripts overlaps significantly with a previously defined set of transcripts oscillating in response to a photocycle. In follow-up studies, all thermocycle-entrained circadian transcript rhythms also responded to light/dark entrainment, whereas some photocycle-entrained rhythms did not respond to temperature entrainment. Transcripts encoding the clock components Period, Timeless, Clock, Vrille, PAR-domain protein 1, and Cryptochrome were all confirmed to be rhythmic after entrainment to a daily thermocycle, although the presence of a thermocycle resulted in an unexpected phase difference between period and timeless expression rhythms at the transcript but not the protein level. Generally, transcripts that exhibit circadian rhythms both in response to thermocycles and photocycles maintained the same mutual phase relationships after entrainment by temperature or light. Comparison of the collective temperature- and light-entrained circadian phases of these transcripts indicates that natural environmental light and temperature cycles cooperatively entrain the circadian clock. This interpretation is further supported by comparative analysis of the circadian phases observed for temperature-entrained and light-entrained circadian locomotor behavior. Taken together, these findings suggest that information from both light and temperature is integrated by the transcriptional clock mechanism in the adult fly head.


Conflict of interest statement

Competing interests. The authors have declared that no competing interests exist.

Figures

Figure 1
Figure 1. Relationship between Daily Light and Temperature Cycles
Under natural environmental conditions, air temperature (purple line and blue = cold/red = warm scale) shows a more gradually changing profile than solar irradiance (gray line and black = dark/white = light scale). Incoming solar energy affects air temperature indirectly via the Earth's surface and this causes a lag between the profiles for sunlight and air temperature, with the temperature maximum and minimum occurring in the late afternoon and just before sunrise, respectively. These profiles are representative of calm, clear days; the lag in the environmental profile can be shortened or lengthened depending on factors such as cloud cover and wind (adapted from [25]).
Figure 2
Figure 2. Comparison of Temperature-Driven, Light-Driven, Light-Entrained Circadian and Temperature-Entrained Circadian Daily Expression Programs
The number of selected rhythmic transcripts for the indicated time course microarray datasets was determined as a function of the estimated FDR (A) or as a function of the threshold applied for the probability associated with 24-h spectral power (B–E). See Materials and Methods for a detailed description of the statistical procedures. Temperature-entrained and light-entrained circadian regulation are represented by 4-d wild-type (4x wt) datasets collected under constant conditions (25 °C in the dark) following temperature entrainment (AA) or light entrainment (DD) in (A) and (D), whereas temperature-driven and light-driven regulation are represented in (A) and (C) by datasets combining 2 d of wild-type plus 1 d of arrhythmic mutant data (2x wt + 1x tim01) collected in the presence of an 18 °C/25 °C thermocycle in the dark (CA) or in the presence of a 12-h light/12-h dark cycle at 25 °C (LD). In addition, datasets are included in (A) and (B) that consist of 2 d of wild-type CA or LD data representing a combination of temperature-driven and temperature-entrained circadian regulation or light-driven and light-entrained circadian regulation, respectively. Finally, 6-d wild-type datasets are considered in (A) and (E) that combine 2x CA and 4x AA or 2x LD and 4x DD data and represent temperature-entrained circadian regulation or light-entrained circadian regulation with some influence from temperature-driven or light-driven responses as well. Note that the y-axis scale in (A) is arithmetic but in (B–E) is geometric. The bracketed numbers in (A) indicate the number of selected transcripts for each of the analyses at FDR ∼0.2. Comparisons of the 24-h periodicity for these various datasets indicate that the circadian expression programs found in response to temperature or light entrainment have very similar properties, but that there is a large clock-independent temperature-driven expression program that clearly has a more global effect than circadian or light-driven regulation.
Figure 3
Figure 3. Phases of the Temperature-Driven Transcripts
(A) Phasegrams for transcripts from wild-type (wt) and tim01 flies in CA/AA are shown. Columns correspond to time points, and transcript profiles are represented by rows. Rows are ordered according to the estimated peak phase of the transcript profiles in CA conditions. Expression values represented by increasingly bright shades of magenta and cyan indicate, respectively, upregulation and downregulation relative to the experimental average (indicated by light gray). (B) Histogram showing the estimated peak phases (ZT h) of the temperature-driven transcripts. The red, blue, and violet bars in (A) and (B) indicate the warm, cold, and subjective cold phases, respectively.
Figure 4
Figure 4. Phases of the Clock-Dependent Transcripts
The transcripts from wild-type flies in CA/AA are shown by phase in the same format as Figure 3. Columns correspond to time points, and transcript profiles are represented by rows. Rows are ordered according to the estimated peak phase of the transcript profiles across the CA/AA data. Expression values represented by increasingly bright shades of magenta and cyan indicate, respectively, upregulation and downregulation relative to the experimental average (indicated by light gray). The red, blue, and violet bars above the phasegram indicate the warm, cold, and subjective cold phases, respectively.
Figure 5
Figure 5. Overlap and Mutual Phase Relationship between Those Transcripts Oscillating in CA/AA and LD/DD
(A) Wild-type transcripts oscillating in response to both photo- and thermocycles are shown by phase in the same format as Figure 3. Columns correspond to time points, and transcript profiles (with gene names listed to the right) are represented by rows. Rows are ordered according to the estimated peak phase of the transcript profiles across the LD/DD data. Expression values represented by increasingly bright shades of magenta and cyan indicate, respectively, upregulation and downregulation relative to the experimental average (indicated by light gray). The red, blue, violet, white, black, and gray bars above the phasegram indicate the warm, cold, subjective cold, light, dark, and subjective light phases, respectively. (B) The phases of transcripts oscillating in CA/AA are “advanced” (relative to the onset of the respective Zeitgeber) by about 6 h as compared to LD/DD. The bars above and to the right of the plot denote the entrainment scheme. Each red square on the plot corresponds to a transcript, with its LD/DD phase indicated on the x-axis and its CA/AA phase indicated on the y-axis. The data were fit to a regression line with slope 1 as indicated.
Figure 6
Figure 6. Overlap Analysis of Independently Determined Circadian Expression Programs after Light or Temperature Entrainment
Three independent 4-d wild-type (4x wt) datasets collected under constant conditions (25 °C in the dark) following temperature entrainment (AA) or light entrainment (DD1 and DD2) are indicated. See Materials and Methods for details. The number of selected rhythmic transcripts for each of these datasets is graphed as a function of the threshold applied for the probability associated with 24-h spectral power (upper three lines). The size of the pairwise overlap between the circadian transcript selections as a function of the selective p-value is also indicated (lower three lines).
Figure 7
Figure 7. Cooperative and Antagonistic Effects of Light and Temperature on Locomotor Activity Behavior
(A–B) The average locomotor activity of a number of flies (A, n = 23; B, n = 18) is represented in each panel. The data are double plotted for visual continuity. Flies were recorded for 4 d in an LD cycle, as indicated by the open and closed bars above the panels, respectively. The flies were then released into DD in which a 25 °C/18 °C temperature cycle was given “in” phase (A, onset of light precedes the onset of warm temperature by 6 h) or “out” of phase (B, onset of warm temperature precedes the onset of light by 6 h). (C) The average times of activity offset relative to the initial LD cycle and the associated standard deviation are indicated on each day for flies with in-phase or out-of-phase thermocycles.
Figure 8
Figure 8. Expression of the Core Clock Genes in Temperature Entrainment
(A) Northern blots showing expression of the core clock transcripts in wild-type flies in CA and AA. An rp49-specific probe was used as a loading control. (B) Quantitations from (A). The bars below the northern images and plots denote the entrainment scheme, with red bars indicating 25 °C time points, blue bars indicating 18 °C time points, and violet bars indicating free-run time points taken at 25 °C. The different colored lines in the vri, tim, and Pdp1 plots represent the different transcripts. At least two independent profiles were obtained for each transcript. Peak to trough ratios (P/T) across the entire experiment, probability of circadian rhythmicity (pF24), and predicted circadian phase relative to the onset of the cryophase (phF24) are as follows. per (P/T = 4.8; pF24 = 0.02; phF24 = CA16), tim (smaller transcript P/T = 5.8; pF24 = 0.0001; phF24 = CA18; larger transcript [timcold] (P/T = 2.7; pF24 = 0.04; phF24 = CA15), Clk (P/T = 2.7; pF24 = 0.0001; phF24 = CA3), cry (P/T = 4.3; pF24 = 0.04; phF24 = CA8), vri (larger transcript P/T = 2.7; pF24 = 0.15; phF24 = CA13; smaller transcript P/T = 2.2; pF24 = 0.12; phF24 = CA19), Pdp1 (transcripts numbered according to increasing size, Pdp1-1 [not visible on blot] P/T = 3.3; pF24 = 0.18; phF24 = CA21, Pdp1-2 P/T = 4.6; pF24 = 0.02; phF24 = CA20, Pdp1-3 P/T = 3.3; pF24 = 0.003; phF24 = CA17, Pdp1-4 P/T = 3.2; pF24 = 0.0003; phF24 = CA15, Pdp1-5 P/T = 3.4; pF24 = 0.003; phF24 = CA15).
Figure 9
Figure 9. tim Is Alternatively Spliced at Cold Temperatures
(A–C) An alternatively spliced form of tim RNA (arrows in A–C) is present in wild-type flies in CA/AA (A), especially during the cold phase, and in LD/DD at 18 °C (C). This splice form is less abundant and distinct in flies entrained to LD/DD at 25 °C (B). An rp49-specific probe was used as a loading control for each blot (lower panels). (D) The alternative transcript contains a predicted premature stop codon and results in a shorter TIM protein isoform (arrow), which can be readily detected in samples collected in LD at 18 °C but is not obvious at 25°C. The horizontal color-coded bars in panels in (A–D) denote the entrainment scheme, with white bars indicating light time points, black bars indicating dark time points, gray bars indicating free-run time points taken during subjective light, red bars indicating 25 °C time points, the blue bar indicating 18 °C time points, and the violet bar indicating free-run time points taken at 25 °C.
Figure 10
Figure 10. Model of How Information from Light and Temperature Are Processed by the Fly Circadian Clock
Information from light and temperature, which is naturally out of phase, is relayed through the appropriate sensors to the clock. In the absence of photic or thermal input, the clock can predict when the fly would have seen light and dark or warm and cold, respectively. When both Zeitgebers are present, they are integrated by the clock to generate meaningful phases of transcription (green). Independently of the clock, light can directly affect (through light sensors) the transcription of a small number of genes (yellow), whereas temperature can drive the expression of a larger number of transcripts (blue). Although some potentially relevant thermal sensors have been reported based on genetic evidence [17], it is unclear to what extent they are involved in determining temperature-entrained and temperature-driven transcript rhythms at a genome-wide level. There are also transcripts that are dually regulated by the clock and light (orange) or temperature (purple), which may be important for processes such as seasonal adaptation.

Similar articles

Cited by

References

    1. Hardin PE. The circadian timekeeping system of Drosophila . Curr Biol. 2005;15:R714–R722. - PubMed
    1. Ashmore LJ, Sathyanarayanan S, Silvestre DW, Emerson MM, Schotland P, et al. Novel insights into the regulation of the Timeless protein. J Neurosci. 2003;23:7810–7819. - PMC - PubMed
    1. Chang DC, Reppert SM. A novel C-terminal domain of Drosophila Period inhibits dClock:Cycle-mediated transcription. Curr Biol. 2003;13:758–762. - PubMed
    1. Cyran SA, Buchsbaum AM, Reddy KL, Lin MC, Glossop NR, et al. vrille, Pdp1, and dClock form a second feedback loop in the Drosophila circadian clock. Cell. 2003;112:329–341. - PubMed
    1. Glossop NRJ, Houl JH, Zheng H, Ng FS, Dudek SM, et al. Vrille feeds back to control circadian transcription of Clock in the Drosophila circadian oscillator. Neuron. 2003;37:249–261. - PubMed

Publication types

MeSH terms

Associated data