. 2007 Jun;26(3):606-14.
doi: 10.1016/j.nbd.2007.02.009. Epub 2007 Mar 3.

Effects of gender on nigral gene expression and parkinson disease

Affiliations

Effects of gender on nigral gene expression and parkinson disease

Ippolita Cantuti-Castelvetri et al. Neurobiol Dis. 2007 Jun.

Abstract

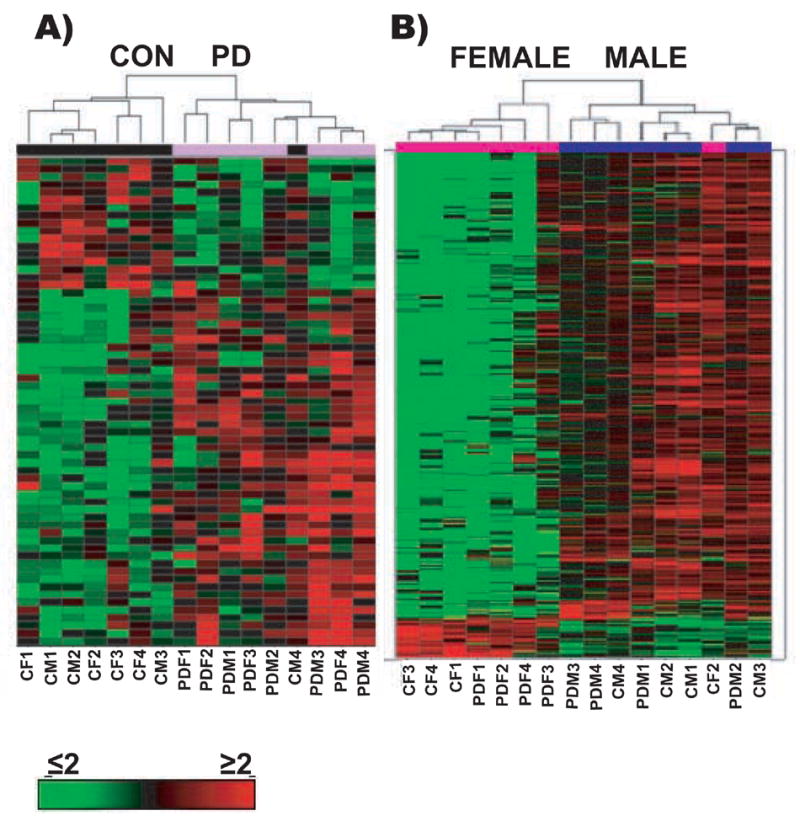
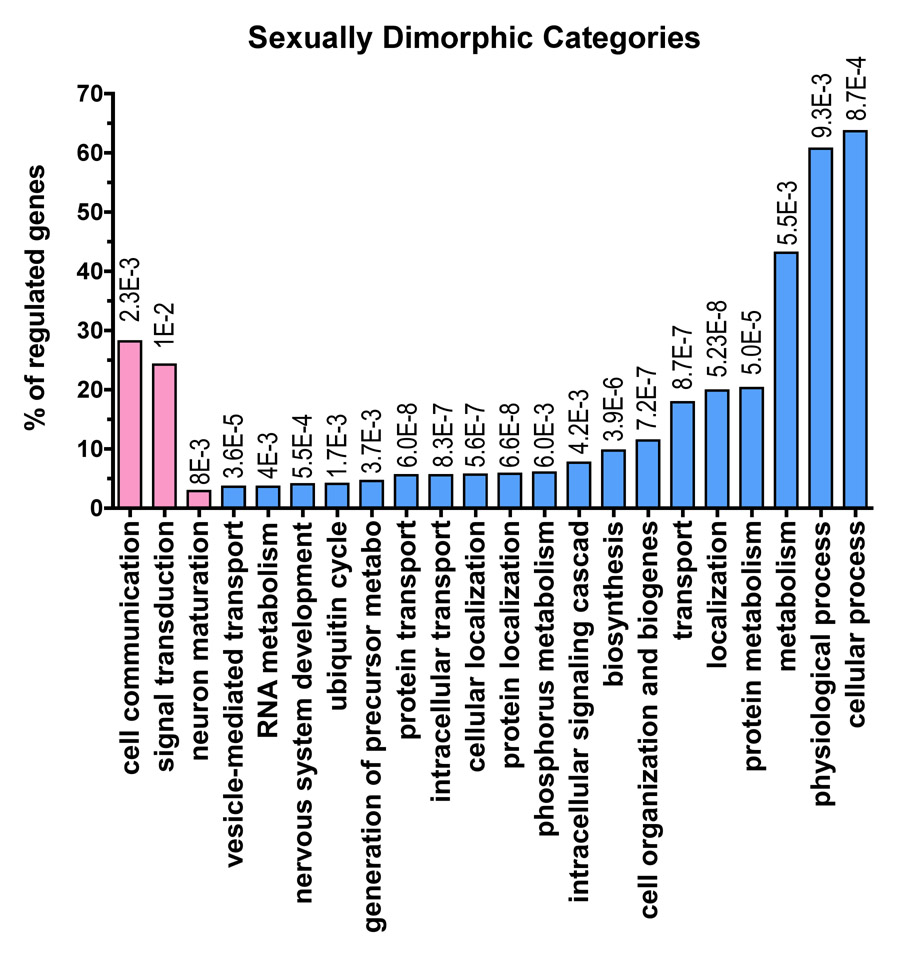
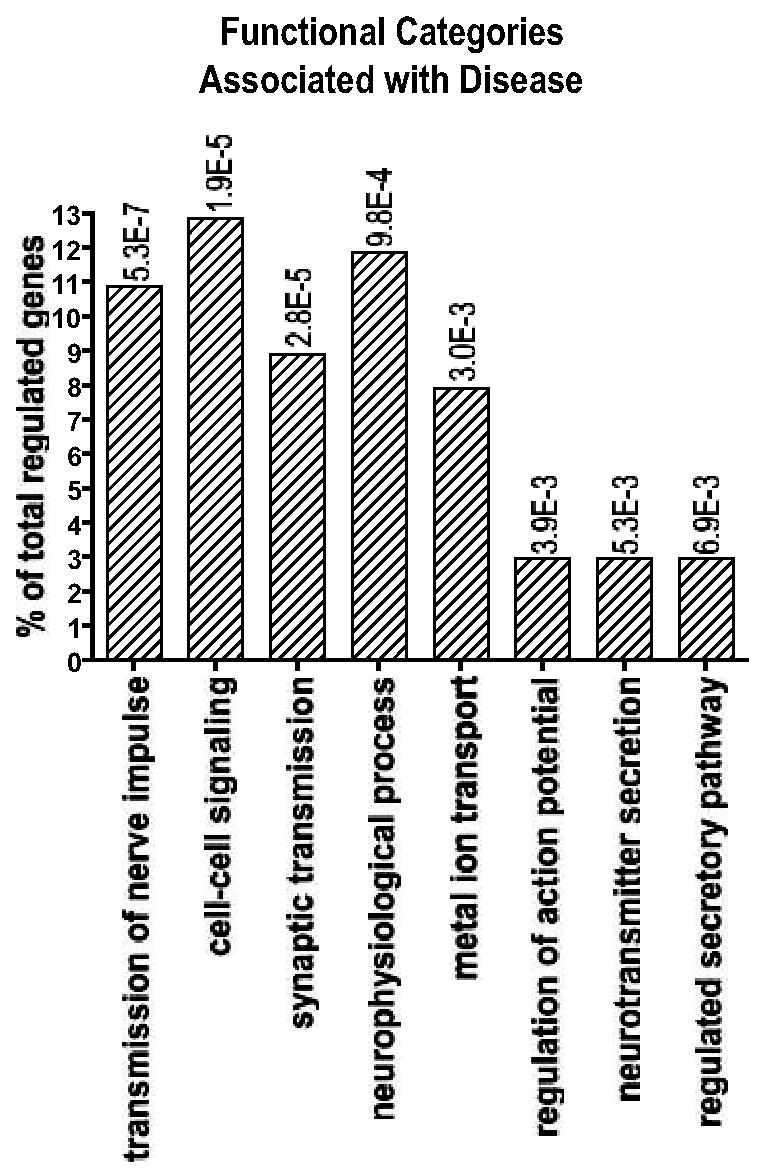
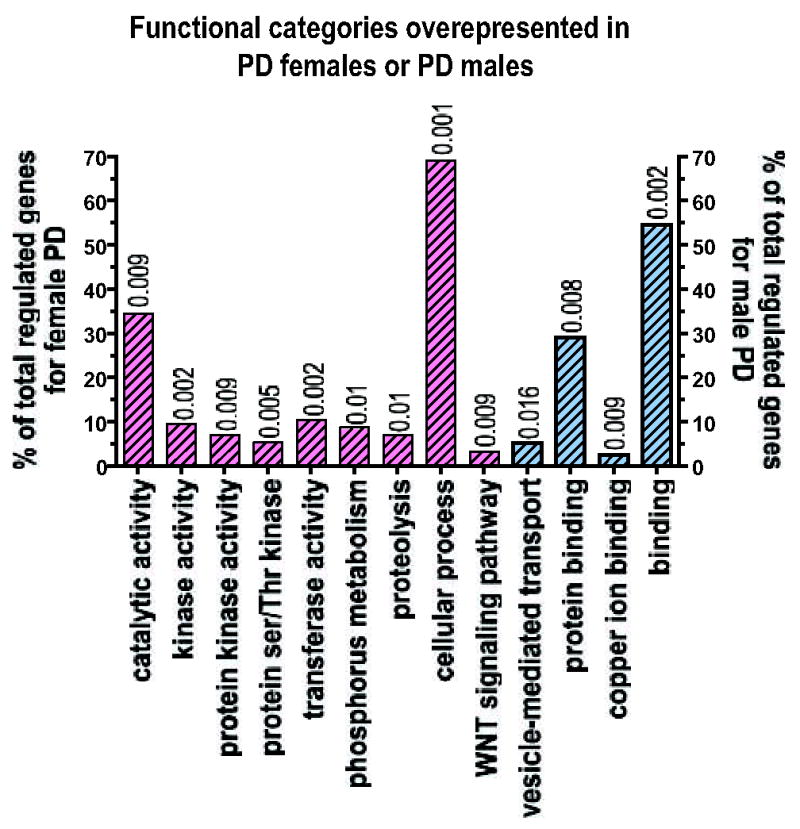
To identify gene expression patterns in human dopamine (DA) neurons in the substantia nigra pars compacta (SNc) of male and female control and Parkinson disease (PD) patients, we harvested DA neurons from frozen SNc from 16 subjects (4 male PDs, 4 female PDs, 4 male and 4 female controls) using Laser Capture microdissection and microarrays. We assessed for enrichment of functional categories with a hypergeometric distribution. The data were validated with QPCR. We observed that gender has a pervasive effect on gene expression in DA neurons. Genes upregulated in females relative to males are mainly involved in signal transduction and neuronal maturation, while in males some of the upregulated genes (alpha-synuclein and PINK1) were previously implicated in the pathogenesis of PD. In females with PD we found alterations in genes with protein kinase activity, genes involved in proteolysis and WNT signaling pathway, while in males with PD there were alterations in protein-binding proteins and copper-binding proteins. Our data reveal broad gender-based differences in gene expression in human dopaminergic neurons of SNc that may underlie the predisposition of males to PD. Moreover, we show that gender influences the response to PD, suggesting that the nature of the disease and the response to treatment may be gender-dependent.


Figures

Figure 1
Figure 1. Hierarchical clustering
Hierarchical clustering on median normalized samples using cosine correlation with complete linkage was performed on all samples to determine the gene clustering and to better visualize differences in expression profiles between the PD patients and healthy control subjects regardless of their gender (panel A, Disease); and between the female and the male subjects regardless of their disease status (panel B, Gender). This approach discriminates well between control and disease cases, with co-clustering of 7 of 8 control cases, and 7 of 8 females.
Figure 2
Figure 2. Functional profiling of the gender-specific genes
124 probe-sets (~ 120 genes) upregulated in the females relative to males, and over 2060 probe-sets (~2000 genes) upregulated in the males relative to females were assigned to functional categories using the Gene Ontology Database. For each functional grouping, the probability that the number of genes observed was greater than chance was calculated according to the hypergeometric distribution (see methods). Only the probe-sets with a multiclass q value<0.11 were used for functional analysis (1870 probe-sets). The table shows the categories identified as significant (p <0.01, # genes in category ≥3% of total regulated genes) for the biological process: Pk= p value; k/u= number of regulated genes observed (k) over the total number of genes in the GO class (u). The regulated genes can be represented under more than one functional term as they can be implicated in one or more biological processes. A list of the genes regulated by gender can be found as supplementary Table 1. The functional categories overrepresented in the gene sets upregulated in the females are shown with the pink bars and the functional categories overrepresented in the gene sets upregulated in males are shown with the light blue bars. At the top of each bar is shown the p value for each functional category. In this figure we show all of the functional categories that are significantly different according to our method. We show both more specific and informative categories such as ‘ubiquitin cycle’ and more broad categories such as ‘cellular process’. Cellular process in only one of eighteen different sub-categories under the parent term ‘biological process’. Some of the categories at the same hierarchical level as ‘cellular process’ are ‘biological adhesion’, ‘reproductive process’ or ‘response to stimulus’ (to search categories and their meaning and hierarchical relationship see QuickGO: http://www.ebi.ac.uk/ego/).
Figure 3
Figure 3. Functional profiling of the Disease-specific genes: Genes common to the two genders
Of 149 probe-sets (35 probe-sets/genes were downregulated in PD, and 114 probe-sets/110 genes were upregulated in PD with respect of controls) regulated by PD, but not by gender, 112 probe-sets with a multiclass q value<0.11 were analyzed using the Gene Ontology Database with a process similar to that used for the gender-specific genes. The table shows the categories identified as significant (p <0.01, # genes in category ≥3% of total regulated genes) for the biological process: Pk= p value; k/u= number of regulated genes observed (k) over the total number of genes in the GO class (u). A list of the disease-specific genes common to the two genders can be found as supplementary Table 2.
Figure 4
Figure 4. Functional profiling of the Disease-specific genes: Gender specific effects of PD
To analyze the functional categories associated with PD females or PD males compared to their respective controls using the Gene Ontology Database with a process similar to that used for the gender-independent genes, we used only probe-sets with a multiclass q value<0.11), i.e. 269 probe-sets out of 289 for the females with PD and 198 probe-sets out of a total of 292. The figure shows the categories for the biological processes and molecular function identified as significant (p <0.01, # genes in category ≥3% of total regulated genes). The pink bars with diagonal bands represent the categories associated with female PD and the light blue bars with diagonal bands represent the functional categories associated with male PD. The complete list of genes regulated in female PD with respect to female controls can be found as supplementary Table 3 and the complete list of genes regulated in male PD with respect to male controls can be found as supplementary Table 4. In this figure we show all of the functional categories that are significantly different according to our method. We show both more specific and informative categories such as ‘ubiquitin cycle’ and more broad categories such as ‘cellular process’. Cellular process in only one of eighteen different sub-categories under the parent term ‘biological process’. Some of the categories at the same hierarchical level as ‘cellular process’ are ‘biological adhesion’, ‘reproductive process’ or ‘response to stimulus’ (to search categories and their meaning and hierarchical relationship see QuickGO: http://www.ebi.ac.uk/ego/).

References

    1. Ascherio A, et al. Caffeine, postmenopausal estrogen, and risk of Parkinson’s disease. Neurology. 2003;60:790–5. - PubMed
    1. Ashburner M, et al. Gene ontology: tool for the unification of biology. The Gene Ontology Consortium. Nat Genet. 2000;25:25–9. - PMC - PubMed
    1. Baldereschi M, et al. Parkinson’s disease and parkinsonism in a longitudinal study: two-fold higher incidence in men. ILSA Working Group. Italian Longitudinal Study on Aging. Neurology. 2000;55:1358–63. - PubMed
    1. Barlow BK, et al. A fetal risk factor for Parkinson’s disease. Dev Neurosci. 2004;26:11–23. - PubMed
    1. Beyer C, et al. Dopamine content and metabolism in mesencephalic and diencephalic cell cultures: sex differences and effects of sex steroids. J Neurosci. 1991;11:1325–33. - PMC - PubMed

Publication types

MeSH terms