Developmental expression of the outer hair cell motor prestin in the mouse
- PMID: 17415610
- PMCID: PMC4154540
- DOI: 10.1007/s00232-007-9004-5
Developmental expression of the outer hair cell motor prestin in the mouse
Abstract
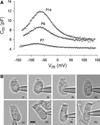
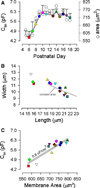
The development of motor protein activity in the lateral membrane of the mouse outer hair cell (OHC) from postnatal day 5 (P5) to P18 was investigated under whole-cell voltage clamp. Voltage-dependent, nonlinear capacitance (C (v)), which represents the conformational fluctuations of the motor molecule, progressively increased during development. At P12, the onset of hearing in the mouse, C (v) was about 70% of the mature level. C (v) saturated at P18 when hearing shows full maturation. On the other hand, C (lin), which represents the membrane area of the OHC, showed a relatively small increase with development, reaching steady state at P10. This early maturation of linear capacitance is further supported by morphological estimates of surface area during development. These results, in light of recent prestin knockout experiments and our results with quantitative polymerase chain reaction, suggest that, rather than the incorporation of new motors into the lateral membrane after P10, molecular motors mature to augment nonlinear capacitance. Thus, current estimates of motor protein density based on charge movement may be exaggerated. A corresponding indicator of motor maturation, the motor's operating voltage midpoint, V (pkcm), tended to shift to depolarized potentials during postnatal development, although it was unstable prior to P10. However, after P14, V (pkcm) reached a steady-state level near -67 mV, suggesting that intrinsic membrane tension or intracellular chloride, each of which can modulate V (pkcm), may mature at P14. These developmental data significantly alter our understanding of the cellular mechanisms that control cochlear amplification and provide a foundation for future analysis of genetic modifications of mouse auditory development.
Figures


Similar articles
-
Effects of membrane potential and tension on prestin, the outer hair cell lateral membrane motor protein.J Physiol. 2001 Mar 15;531(Pt 3):661-6. doi: 10.1111/j.1469-7793.2001.0661h.x. J Physiol. 2001. PMID: 11251048 Free PMC article.
-
Functional prestin transduction of immature outer hair cells from normal and prestin-null mice.J Assoc Res Otolaryngol. 2008 Sep;9(3):307-20. doi: 10.1007/s10162-008-0121-3. Epub 2008 May 28. J Assoc Res Otolaryngol. 2008. PMID: 18506528 Free PMC article.
-
Temperature dependence of non-linear capacitance in human embryonic kidney cells transfected with prestin, the outer hair cell motor protein.Neurosci Lett. 2001 Nov 9;313(3):141-4. doi: 10.1016/s0304-3940(01)02266-2. Neurosci Lett. 2001. PMID: 11682147
-
Prestin, a new type of motor protein.Nat Rev Mol Cell Biol. 2002 Feb;3(2):104-11. doi: 10.1038/nrm730. Nat Rev Mol Cell Biol. 2002. PMID: 11836512 Review.
-
Prestin and electromotility may serve multiple roles in cochlear outer hair cells.Hear Res. 2022 Sep 15;423:108428. doi: 10.1016/j.heares.2021.108428. Epub 2021 Dec 26. Hear Res. 2022. PMID: 34987016 Review.
Cited by
-
Developmental changes in the cochlear hair cell mechanotransducer channel and their regulation by transmembrane channel-like proteins.J Gen Physiol. 2013 Jan;141(1):141-8. doi: 10.1085/jgp.201210913. J Gen Physiol. 2013. PMID: 23277480 Free PMC article.
-
Working with Auditory HEI-OC1 Cells.J Vis Exp. 2016 Sep 3;(115):54425. doi: 10.3791/54425. J Vis Exp. 2016. PMID: 27684094 Free PMC article.
-
Functional Postnatal Maturation of the Medial Olivocochlear Efferent-Outer Hair Cell Synapse.J Neurosci. 2020 Jun 17;40(25):4842-4857. doi: 10.1523/JNEUROSCI.2409-19.2020. Epub 2020 May 19. J Neurosci. 2020. PMID: 32430293 Free PMC article.
-
Prestin-Dependence of Outer Hair Cell Survival and Partial Rescue of Outer Hair Cell Loss in PrestinV499G/Y501H Knockin Mice.PLoS One. 2015 Dec 18;10(12):e0145428. doi: 10.1371/journal.pone.0145428. eCollection 2015. PLoS One. 2015. PMID: 26682723 Free PMC article.
-
Loss of Baiap2l2 destabilizes the transducing stereocilia of cochlear hair cells and leads to deafness.J Physiol. 2021 Feb;599(4):1173-1198. doi: 10.1113/JP280670. Epub 2020 Nov 26. J Physiol. 2021. PMID: 33151556 Free PMC article.
References
Publication types
MeSH terms
Substances
Grants and funding
LinkOut - more resources
Full Text Sources
Research Materials
Miscellaneous

