

Scattering of exciting light by live cells in fluorescence confocal imaging: phototoxic effects and relevance for FRAP studies
- PMID: 17416613
- PMCID: PMC1948059
- DOI: 10.1529/biophysj.106.096636
Scattering of exciting light by live cells in fluorescence confocal imaging: phototoxic effects and relevance for FRAP studies
Abstract
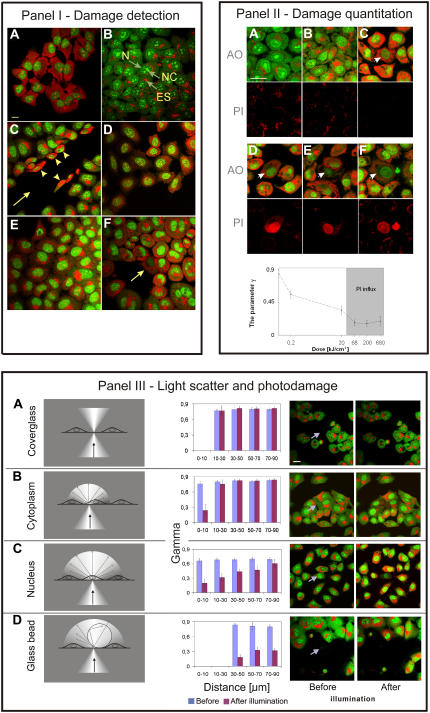
As exciting light in a scanning confocal microscope encounters a cell and its subcellular components, it is refracted and scattered. A question arises as to what proportion of the exciting light is scattered by subcellular structures and whether cells in the vicinity of the imaged area, i.e., cells that are not directly illuminated by the laser beam, can be affected by either an exposure to scattered light and ensuing phototoxic reactions, or by the products of photoactivated reactions diffusing out of the directly illuminated area. We have designed a technique, which allows us to detect subtle cell photodamage and estimate the extent and range of phototoxic effects inflicted by interaction between scattered exciting light and fluorescent probes in the vicinity of the illuminated area. The technique is based on detecting an increased influx of acridine orange into photodamaged cells, which is manifested by a change of color. We demonstrate that phototoxic effects can be exerted not only on the illuminated cell, but also on fluorescently labeled neighboring cells. The damage inflicted on neighbors is due to exposure to light scattered by the imaged (i.e., directly illuminated) cell, but not phototoxic products diffusing out of the directly illuminated area. When light encounters a cell nucleus, scattering is so intense that photodamage can be inflicted even on fluorescently labeled cells located within a radius of approximately 90 microm, i.e., several cell diameters away. This range of scattering is comparable with that caused by the glass bead resting on a coverslip (up to 120 microm). The intense scattering of exciting light imposes limits on FRAP, FLIP, and other techniques employing high intensity laser beams.
Figures
Similar articles
-
A mercury arc lamp-based multi-color confocal real time imaging system for cellular structure and function.Cell Struct Funct. 2008;33(1):133-41. doi: 10.1247/csf.08015. Epub 2008 Aug 6. Cell Struct Funct. 2008. PMID: 18685226
-
Live-cell nucleocytoplasmic protein shuttle assay utilizing laser confocal microscopy and FRAP.Biotechniques. 2002 Jan;32(1):80-2, 84, 86-7. doi: 10.2144/02321st04. Biotechniques. 2002. PMID: 11808703
-
Continuous photobleaching in vesicles and living cells: a measure of diffusion and compartmentation.Biophys J. 2006 Apr 1;90(7):2548-62. doi: 10.1529/biophysj.105.069815. Epub 2006 Jan 20. Biophys J. 2006. PMID: 16428281 Free PMC article.
-
Molecular photobleaching kinetics of Rhodamine 6G by one- and two-photon induced confocal fluorescence microscopy.Chemphyschem. 2005 May;6(5):791-804. doi: 10.1002/cphc.200400509. Chemphyschem. 2005. PMID: 15884061 Review.
-
Coherent anti-stokes Raman scattering microscopy: a biological review.Cytometry A. 2006 Aug 1;69(8):779-91. doi: 10.1002/cyto.a.20299. Cytometry A. 2006. PMID: 16752420 Review.
Cited by
-
Quantifying Single mRNA Translation Kinetics in Living Cells.Cold Spring Harb Perspect Biol. 2018 Nov 1;10(11):a032078. doi: 10.1101/cshperspect.a032078. Cold Spring Harb Perspect Biol. 2018. PMID: 30385605 Free PMC article. Review.
-
Internal dynamics of a living cell nucleus investigated by dynamic light scattering.Eur Phys J E Soft Matter. 2008 Aug;26(4):435-48. doi: 10.1140/epje/i2007-10346-5. Eur Phys J E Soft Matter. 2008. PMID: 19230214
-
Aqueous mounting media increasing tissue translucence improve image quality in Structured Illumination Microscopy of thick biological specimen.Sci Rep. 2018 Sep 18;8(1):13971. doi: 10.1038/s41598-018-32191-x. Sci Rep. 2018. PMID: 30228281 Free PMC article.
-
Multimodal Light Microscopy Approaches to Reveal Structural and Functional Properties of Promyelocytic Leukemia Nuclear Bodies.Front Oncol. 2018 May 25;8:125. doi: 10.3389/fonc.2018.00125. eCollection 2018. Front Oncol. 2018. PMID: 29888200 Free PMC article. Review.
-
Rational Design of Bioavailable Photosensitizers for Manipulation and Imaging of Biological Systems.Cell Chem Biol. 2020 Aug 20;27(8):1063-1072.e7. doi: 10.1016/j.chembiol.2020.07.001. Epub 2020 Jul 21. Cell Chem Biol. 2020. PMID: 32698018 Free PMC article.
References
-
- Cheong, W.-F., S. A. Prahl, and A. J. Welch. 1990. A review of the optical properties of biological tissues. IEEE J. Quantum Electron. 26:2166–2185.
-
- Perelman, L. T., J. Wu, I. Itzkan, and M. S. Field. 1994. Photon migration in turbid media using path integrals. Phys. Rev. Lett. 72:1341–1344. - PubMed
-
- Yodh, A. G., and B. Chance. 1995. Spectroscopy and imaging with diffusing light. Phys. Today. 48:34–40.
-
- Oldfield, R. 1994. Light Microscopy. An Illustrated Guide. Wolfe Publishing, London.
-
- Torok, P., Z. Laczik, and J. N. Skepper. 1996. Simple modification of a commercial scanning laser microscope to incorporate dark-field imaging. J. Microsc. 181:260–268. - PubMed
Publication types
MeSH terms
Substances
Grants and funding
LinkOut - more resources
Full Text Sources
Research Materials
Miscellaneous
