Comparative Study
. 2007 Jul 1;93(1):123-39.
doi: 10.1529/biophysj.106.095513. Epub 2007 Apr 6.

A freeze-fracture transmission electron microscopy and small angle x-ray diffraction study of the effects of albumin, serum, and polymers on clinical lung surfactant microstructure

Affiliations
Comparative Study

A freeze-fracture transmission electron microscopy and small angle x-ray diffraction study of the effects of albumin, serum, and polymers on clinical lung surfactant microstructure

Andreas Braun et al. Biophys J. .

Abstract

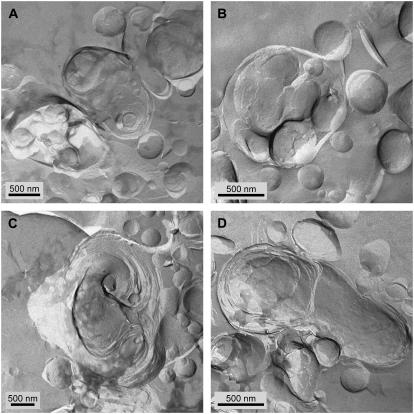
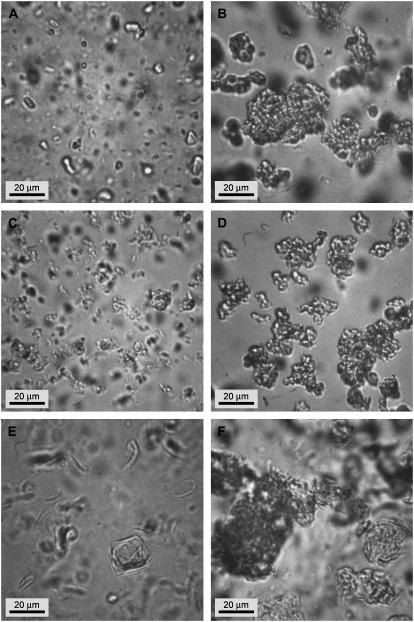
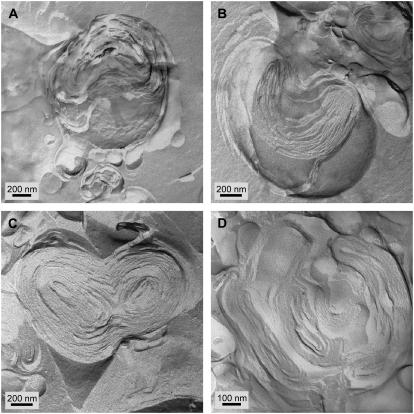
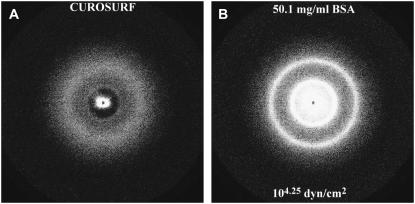
Freeze-fracture transmission electron microscopy shows significant differences in the bilayer organization and fraction of water within the bilayer aggregates of clinical lung surfactants, which increases from Survanta to Curosurf to Infasurf. Albumin and serum inactivate all three clinical surfactants in vitro; addition of the nonionic polymers polyethylene glycol, dextran, or hyaluronic acid also reduces inactivation in all three. Freeze-fracture transmission electron microscopy shows that polyethylene glycol, hyaluronic acid, and albumin do not adsorb to the surfactant aggregates, nor do these macromolecules penetrate the interior water compartments of the surfactant aggregates. This results in an osmotic pressure difference that dehydrates the bilayer aggregates, causing a decrease in the bilayer spacing as shown by small angle x-ray scattering and an increase in the ordering of the bilayers as shown by freeze-fracture electron microscopy. Small angle x-ray diffraction shows that the relationship between the bilayer spacing and the imposed osmotic pressure for Curosurf is a screened electrostatic interaction with a Debye length consistent with the ionic strength of the solution. The variation in surface tension due to surfactant adsorption measured by the pulsating bubble method shows that the extent of surfactant aggregate reorganization does not correlate with the maximum or minimum surface tension achieved with or without serum in the subphase. Albumin, polymers, and their mixtures alter the surfactant aggregate microstructure in the same manner; hence, neither inhibition reversal due to added polymer nor inactivation due to albumin is caused by alterations in surfactant microstructure.


Figures

FIGURE 1
FIGURE 1
FFTEM images of Curosurf at a concentration of 80 mg/ml (A, B) and 10 mg/ml (CF), quenched from room temperature. (A, B) Multilamellar aggregates with a broad size distribution. The smallest spherical particles may be unilamellar vesicles. (CE) Multilamellar aggregates often had some void space between bilayers and “pockets” of water within the aggregate. This is consistent with the small angle x-ray scattering that showed broad reflections indicative of poor correlations between the bilayers. (F) Multilamellar dumbbell-shaped aggregate.
FIGURE 2
FIGURE 2
FFTEM images of Infasurf at a concentration of 10 mg/ml, quenched from room temperature. (A) Small, fairly monodisperse unilamellar vesicles with average diameter of 250 nm ± 100 nm. (B) Densely packed small vesicles within another bilayer membrane, indicated by the bumpy surface, where the densely packed vesicles push against the outer membrane. Small vesicles appear to be loosely bound to the larger aggregate. (CF) Cross-fractured Infasurf aggregates with densely packed interior vesicles and large water pockets. The diameters range from 0.5 to 4 μm. The structures are similar to vesosomes, a vesicle in vesicle drug delivery vehicle (73,74).
FIGURE 3
FIGURE 3
FFTEM images of Survanta at a concentration of 10 mg/ml (A, B) and 2 mg/ml (C, D), quenched from room temperature. (A, C) Most aggregates were too large to be imaged as individual particles in TEM. Here we shod the multilamellar stacks of well-ordered bilayers within the larger aggregates. There are no water pockets within the Survanta particles. (B, D) The only other structures observed are small vesicles that range from 50 to 300 nm in diameter.
FIGURE 4
FIGURE 4
Optical phase contrast microscopy images of Survanta at a concentration of 1 mg/ml. Aggregates size range from 5 up to 60 μm and show large open bilayer structures (A, arrow), low density bilayer aggregates (B, D), and higher density multilayer aggregates (B, C).
FIGURE 5
FIGURE 5
FFTEM images of 10 mg/ml Curosurf with bovine serum albumin (BSA) at different concentrations, quenched from room temperature. (A) cBSA = 0.5 mg/ml. (B) cBSA = 1 mg/ml. (C) cBSA = 2 mg/ml. (D) cBSA = 5 mg/ml. Adding BSA at different concentrations did not change the aggregate structures in comparison to Fig. 1. The microstructure of the aggregates was multilamellar with interior voids and water pockets and poorly correlated bilayers as in Fig. 1. The size distribution of the aggregates was unchanged and ranged 0.5–3 microns.
FIGURE 6
FIGURE 6
FFTEM images of Infasurf (A, B) and Survanta (C, D) at 10 mg/ml after adding bovine serum albumin (BSA) at a concentration of 2 mg/ml, quenched from room temperature. Adding BSA did not change the aggregate structures of either formulation. (A, B) Infasurf showed small, fairly monodisperse vesicles and densely packed vesicle aggregates. The bilayer surfaces were smooth, indicating no adsorption or perturbation by the albumin. (C, D) Survanta primarily formed stacks of bilayer sheets and only a few small vesicles with no evidence of albumin adsorption (see Figs. 2 and 3).
FIGURE 7
FIGURE 7
Optical phase contrast microscopy images of Curosurf (A, B), Infasurf (C, D), and Survanta (E, F) before and after 5 wt% 10 kDa PEG addition. (A, C, E) Without PEG, all of the clinical surfactants consisted of dispersed, small aggregates (B, D, F). Adding PEG induced flocculation of the small aggregates and formed large agglomerations of up to 100 μm. These large flocs could be redispersed by gentle agitation, indicating that the forces holding the flocs together were reversible, which is typical for depletion attraction (18,79).
FIGURE 8
FIGURE 8
FFTEM images of 10 mg/ml Curosurf after adding 5 wt % 10 kDa PEG at different concentrations. (A) cPEG = 1 wt %. (B) cPEG = 5 wt %. (C) cPEG = 10 wt %. (D) cPEG = 20 wt %. As in the optical images (Fig. 7), the PEG caused flocculation of the surfactant aggregates. In addition, there appeared to be fusion of the smaller vesicles and the bilayers became better ordered within the aggregates. The pockets of water and void spaces were eliminated at the higher PEG fractions. This is consistent with the PEG acting as a nonpenetrating osmotic agent that dehydrates the surfactant aggregates.
FIGURE 9
FIGURE 9
Bilayer d-spacing measured by small angle x-ray scattering from dispersions of Curosurf, Curosurf plus albumin, and Curosurf plus albumin and PEG polymer as a function of the osmotic pressure of polymer or polymer plus albumin. For osmotic pressures >103 dynes/cm2, the d-spacing decreases exponentially with increasing osmotic pressure with a decay length of 0.72 nm, which is nearly identical to the calculated Debye length of the solvent. The albumin and polymer act primarily as osmotic agents that dehydrate the bilayers, as in the TEM images. This confirms that albumin and polymer do not adsorb to or penetrate the surfactant aggregates.
FIGURE 10
FIGURE 10
Small angle x-ray diffraction of Curosurf (A) as received and (B) with 50.1 mg/ml bovine serum albumin, which is equivalent to an osmotic pressure of 104.25 dynes/cm2. As received, the single bilayer reflection from Curosurf is broad, indicative of poorly organized bilayers as in Fig. 8 A. After dehydration and rearrangement due to the osmotic pressure induced by the added BSA, the bilayer spacing has decreased and the order of the bilayers has increased, as shown by the much sharper reflections along with the appearance of the second reflection.
FIGURE 11
FIGURE 11
FFTEM images of 10 mg/ml Infasurf after adding 5 wt % 10 kDa PEG. (AD) The PEG caused the Infasurf aggregates to compact and dehydrate; there were no longer vesicle within vesicle structures, but rather onion-like multilamellar particles. The small vesicles appear to bind to and fuse with the larger particles (arrows).
FIGURE 12
FIGURE 12
FFTEM images of 10 mg/ml Infasurf after adding 0.25 wt % 250 kDa HA. (A, B) The HA caused minimal variation in the microstructure of the Infasurf particles. The open vesicle within a vesicle structure seen in Fig. 2 is retained. Compare to the onion-like structures in Fig. 11. Many of the small vesicles remain unfused. The lower osmotic pressure of the HA is not sufficient to cause significant rearrangement of the Infasurf bilayers.

References

    1. Clements, J. A., and M. E. Avery. 1998. Lung surfactant and neonatal respiratory distress syndrome. Am. J. Respir. Crit. Care Med. 157:59–66. - PubMed
    1. Zasadzinski, J. A., J. Ding, H. E. Warriner, F. Bringezu, and A. J. Waring. 2001. The physics and physiology of lung surfactants. Curr. Opinion Coll. Int. Sci. 6:506–513.
    1. Avery, M. E. 2000. Surfactant deficiency in hyaline membrane disease. Am. J. Respir. Crit. Care Med. 161:1074–1075. - PubMed
    1. Notter, R. H. 2000. Lung Surfactant: Basic Science and Clinical Applications. Marcel Dekker, New York.
    1. Suresh, G. K., and R. F. Soll. 2005. Overview of surfactant replacement trials. J. Perinatol. 25:S40–S44. - PubMed

Publication types

LinkOut - more resources