

A fiber-based ratiometric optical cardiac mapping channel using a diffraction grating and split detector
- PMID: 17416627
- PMCID: PMC1914424
- DOI: 10.1529/biophysj.106.101154
A fiber-based ratiometric optical cardiac mapping channel using a diffraction grating and split detector
Abstract
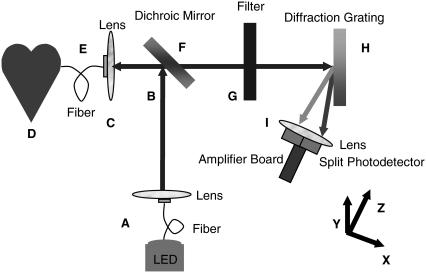
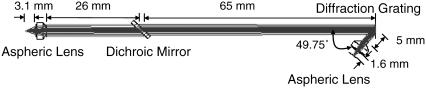
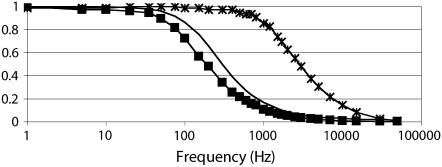
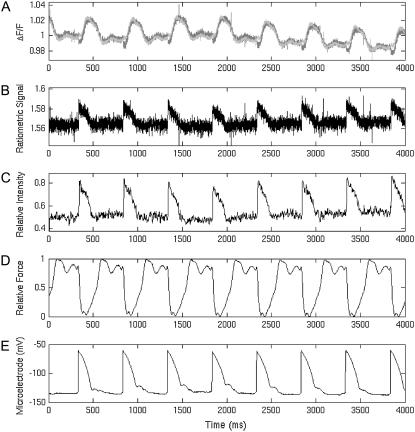
Optical fiber-based mapping systems are used to record the cardiac action potential (AP) throughout the myocardium. The optical AP contains a contraction-induced motion artifact (MA), which makes it difficult to accurately measure the action potential duration (APD). MA is removed by preventing contraction with electrical-mechanical uncoupling drugs, such as 2,3-butanedione monoxime (BDM). We designed a novel fiber-based ratiometric optical channel using a blue light emitting diode, a diffraction grating, and a split photodetector that can accurately measure the cardiac AP without the need for BDM. The channel was designed based on simulations using the optical design software ZEMAX. The channel has an electrical bandwidth of 150 Hz and an root mean-square dark noise of 742 muV. The channel successfully recorded the cardiac AP from the wall of five rabbit heart preparations without the use of BDM. After 20-point median filtering, the mean signal/noise ratio was 25.3 V/V. The APD measured from the base of a rabbit heart was 134 +/- 8.4 ms, compared to 137.6 +/- 3.3 ms from simultaneous microelectrode recordings. This difference was not statistically significant (p-value = 0.3). The quantity of MA removed was also measured using the motion ratio. The reduction in MA was significant (p-value = 0.0001). This fiber-based system is the first of its kind to enable optical APD measurements in the beating heart wall without the use of BDM.
Figures


Similar articles
-
Toward microendoscopy-inspired cardiac optogenetics in vivo: technical overview and perspective.J Biomed Opt. 2014 Aug;19(8):080701. doi: 10.1117/1.JBO.19.8.080701. J Biomed Opt. 2014. PMID: 25117076 Free PMC article. Review.
-
A low-cost high-efficiency fiber-optic coupler for recording action potentials within the myocardial wall.IEEE Trans Biomed Eng. 2006 Aug;53(8):1708-11. doi: 10.1109/TBME.2006.873758. IEEE Trans Biomed Eng. 2006. PMID: 16916108
-
Intramural measurement of transmembrane potential in the isolated pig heart: validation of a novel technique.J Cardiovasc Electrophysiol. 2005 Sep;16(9):1001-10. doi: 10.1111/j.1540-8167.2005.40558.x. J Cardiovasc Electrophysiol. 2005. PMID: 16174023
-
Two-point electrical-fluorescence recording from heart with optical fibers.IEEE Trans Biomed Eng. 1994 Dec;41(12):1191-4. doi: 10.1109/10.335869. IEEE Trans Biomed Eng. 1994. PMID: 7851921
-
Macroscopic optical mapping of excitation in cardiac cell networks with ultra-high spatiotemporal resolution.Prog Biophys Mol Biol. 2006 Oct;92(2):232-57. doi: 10.1016/j.pbiomolbio.2005.10.003. Epub 2005 Nov 21. Prog Biophys Mol Biol. 2006. PMID: 16330086 Review.
Cited by
-
Simultaneous optical mapping of intracellular free calcium and action potentials from Langendorff perfused hearts.Curr Protoc Cytom. 2009 Jul;Chapter 12:Unit 12.17. doi: 10.1002/0471142956.cy1217s49. Curr Protoc Cytom. 2009. PMID: 19575468 Free PMC article.
-
Imaging technologies for cardiac fiber and heart failure: a review.Heart Fail Rev. 2018 Mar;23(2):273-289. doi: 10.1007/s10741-018-9684-1. Heart Fail Rev. 2018. PMID: 29500602 Free PMC article.
-
Cardiac electrophysiological imaging systems scalable for high-throughput drug testing.Pflugers Arch. 2012 Dec;464(6):645-56. doi: 10.1007/s00424-012-1149-0. Epub 2012 Sep 29. Pflugers Arch. 2012. PMID: 23053475 Free PMC article.
-
Toward microendoscopy-inspired cardiac optogenetics in vivo: technical overview and perspective.J Biomed Opt. 2014 Aug;19(8):080701. doi: 10.1117/1.JBO.19.8.080701. J Biomed Opt. 2014. PMID: 25117076 Free PMC article. Review.
-
Simultaneous optical mapping of transmembrane potential and wall motion in isolated, perfused whole hearts.J Biomed Opt. 2011 Sep;16(9):096020. doi: 10.1117/1.3630115. J Biomed Opt. 2011. PMID: 21950934 Free PMC article.
References
-
- Byars, J. L., W. M. Smith, R. E. Ideker, and V. G. Fast. 2003. Development of an optrode for intramural multisite optical recordings of Vm in the heart. J. Cardiovasc. Electrophysiol. 14:1196–1202. - PubMed
-
- Caldwell, B. J., I. J. LeGrice, D. A. Hooks, D. C.-S. Tai, A. J. Pullan, and B. Smaill. 2005. Intramural measurement of transmembrane potential in the isolated pig heart: validation of a novel technique. J. Cardiovasc. Electrophysiol. 16:1001–1010. - PubMed
-
- Krauthamer, V., H. Bryant, C. Davis, and T. Athey. 1991. Action potential-induced fluorescence changes resolved with an optical fiber carrying excitation light. J. Fluoresc. 1:207–213. - PubMed
-
- Neunlist, M., S. Zou, and L. Tung. 1992. Design and use of an optrode for optical recordings of cardiac action potentials. Eur. J. Physiol. 420:611–617. - PubMed
Publication types
MeSH terms
Grants and funding
LinkOut - more resources
Full Text Sources
