. 2007 Jul 1;93(1):11-20.
doi: 10.1529/biophysj.106.100263. Epub 2007 Apr 6.

Stochastic signal processing and transduction in chemotactic response of eukaryotic cells

Affiliations

Stochastic signal processing and transduction in chemotactic response of eukaryotic cells

Masahiro Ueda et al. Biophys J. .

Abstract

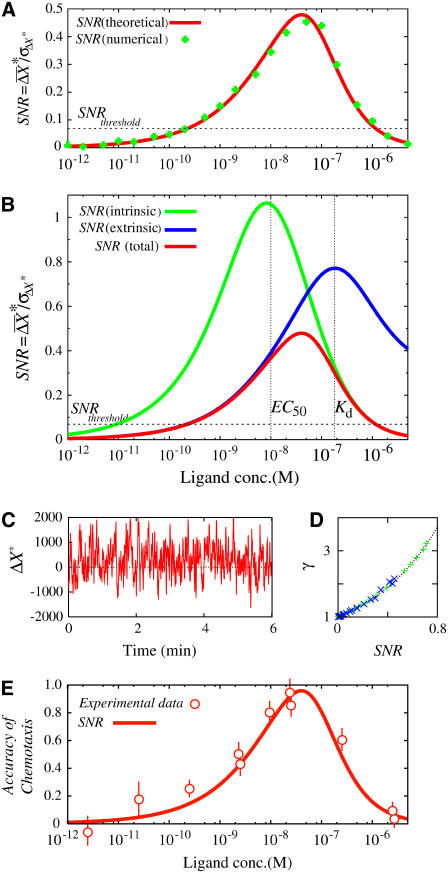
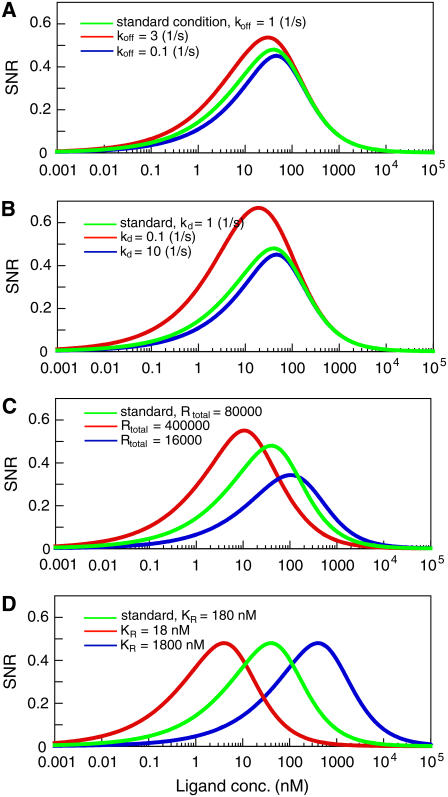
Single-molecule imaging analysis of chemotactic response in eukaryotic cells has revealed a stochastic nature in the input signals and the signal transduction processes. This leads to a fundamental question about the signaling processes: how does the signaling system operate under stochastic fluctuations or noise? Here, we report a stochastic model of chemotactic signaling in which noise and signal propagation along the transmembrane signaling pathway by chemoattractant receptors can be analyzed quantitatively. The results obtained from this analysis reveal that the second-messenger-production reactions by the receptors generate noisy signals that contain intrinsic noise inherently generated at this reaction and extrinsic noise propagated from the ligand-receptor binding. Such intrinsic and extrinsic noise limits the directional sensing ability of chemotactic cells, which may explain the dependence of chemotactic accuracy on chemical gradients that has been observed experimentally. Our analysis also reveals regulatory mechanisms for signal improvement in the stochastically operating signaling system by analyzing how the SNR of chemotactic signals can be improved on or deteriorated by the stochastic properties of receptors and second-messenger molecules. Theoretical consideration of noisy signal transduction by chemotactic signaling systems can further be applied to signaling systems in general.


Figures

FIGURE 1
FIGURE 1
Fluctuations in signal inputs for chemotactic response. (A) Single-molecule imaging of a fluorescent-labeled cAMP (Cy3-cAMP) bound to the receptor in living Dictyostelium cells. Cy3-cAMP was added uniformly to Dictyostelium cells at 10 nM. The basal surface of the cells was observed by using total internal reflection fluorescence microscopy, as described previously (19,32). Individual white spots are single molecules of Cy3-cAMP bound to the receptors in living cells. Time, h:min:s. Scale bar, 5 μm. (B) Cumulative frequency histogram of lifetime of Cy3-cAMP spots. The lifetimes of individual Cy3-cAMP molecules were obtained by counting the time duration between the appearance and disappearance of the fluorescent spots. The line represents the fitting of data to a sum of two exponential functions, formula image where a1, a2, k1, and k2 are fitting parameters. k1 and k2 are dissociation rates, the inverse of the average lifetime. The number of Cy3-cAMP spots analyzed was 1024. k1 = 1.0 and k2 = 0.13 s−1. a1 = 74.3% and a2 = 31.4%. (C) Time course of the number of Cy3-cAMP spots bound to the basal surface of the cells, showing the number fluctuations of signal inputs for chemotactic response.
FIGURE 2
FIGURE 2
Stochastic model of chemotactic signaling. (A) Signal transduction reactions by chemoattractant receptors. The ligand (L) binds to the inactive receptor (R), leading to the formation of an active receptor (R*), which produces the active second messenger (X*) from the inactive precursor (X). The active X* is switched off to the inactive state, X, in due time. These reactions can be described by Michaelis-Menten kinetics. (B) The cell is placed under a ligand-concentraion gradient. L, average concentration; ΔL, difference in ligand concentration between the anterior and posterior ends of the cell. The anterior and posterior halves sense formula image and formula image on average, respectively. The difference in receptor occupancy ΔR* is produced from ligand-concentration differences, which lead to the difference in second messenger, ΔX*, between the anterior and posterior halves. The differences ΔR* and ΔX* should include the noise formula image and formula image around average values formula image and formula image respectively.
FIGURE 3
FIGURE 3
Relationship between gain and noise. (A) Active receptor concentration (R*; solid line) and gain (gR; dashed line) plotted as functions of ligand concentration. (B) Dependence of the gain gX on receptor occupancy. (C) Dependence of relative noise in R* on ligand concentration. (D) Dependence of relative noise in X* on ligand concentration. Extrinsic noise and intrinsic noise are represented by black dashed and solid lines, respectively. The total noise strength is represented by the red solid line. The parameter values used for the calculation are summarized in Table 1. (Inset) Log-log plot. Extrinsic noise contributes dominantly to the total noise in the lower ligand-concentration range, whereas intrinsic noise contributes dominantly in the higher ligand-concentration ranges.
FIGURE 4
FIGURE 4
SNR of chemotactic signals. (A) Dependence of the SNR on ligand concentation obtained theoretically by Eq. 4 (red line) and numerically (green diamonds). The cell is located without locomotion under a linear chemoattractant gradient of 2% along the anterior-posterior axis with the midpoint concentration L. The parameter values used for the calculation are summarized in Table 1. For the simulation, the spatial coordinate of the cell is discretized into small boxes appropriately, and the reactions take place in each box according to the Gillespie's algorithm (44). (B) Relative contributions of extrinsic (blue) and intrinsic (green) noises on the total SNR of chemotactic signals (red). (C) Numerical calculation of chemotactic signals. Time course of second-messenger concentration difference (ΔX*) between anterior and posterior halves of single cells. L = 0.01 μM. (D) A proportional relation between the SNR of chemotactic signals and γ, which represents the ratio between the total time durations with ΔX* > 0 and ΔX* < 0. Dashed line, formula image where Erf(x) is the error function. (E) Comparison of the SNR with Fisher's experimental data for chemotactic accuracy of Dictyostelium cells (14). The SNR obtained theoretically (red line) was overlaid on the experimental data (red circles). (Adapted from Fig. 5 of Fisher et al. (14) with permission). The SNR was plotted on the same scale as in A.
FIGURE 5
FIGURE 5
Signal improvements. (A) Receptor fluctuation-dependent signal improvements. The dissociation rates of a ligand ( koff) were changed: (blue line) 0.1 s−1; (green line) 1 s−1 (standard condition); (red line) 3 s−1. (B) Time-averaging effects. The SNR was improved by increasing the time constants of the second messenger. The degradation rates (kd) were changed and the corresponding SNR was calculated: (blue line) 10 s−1; (green line) 1 s−1; (red line) 0.1 s−1. (C) Dependency of the SNR on the expression levels of receptors. The receptor numbers per single cell are 16,000 (blue), 80,000 (green), and 400,000 (red) molecules/cell. (D) Effects of affinity modulation on the SNR. Ligand-binding affinity: 18 nM (red), 180 nM (green), and 1800 nM (blue).

References

    1. Ishijima, A., and T. Yanagida. 2001. Single molecule nanobioscience. Trends Biochem. Sci. 26:438–444. - PubMed
    1. Sako, Y., and T. Yanagida. 2003. Single-molecule visualization in cell biology. Nat. Rev. Mol. Cell Biol. 4:SS1–SS5. - PubMed
    1. Sakmann, B., and E. Neher. 1995. Single Channel Recording. Plenum, New York.
    1. Funatsu, T., Y. Harada, M. Tokunaga, K. Saito, and T. Yanagida. 1995. Imaging of single fluorescent molecules and individual ATP turnovers by single myosin molecules in aqueous solution. Nature. 374:555–559. - PubMed
    1. Lu, H. P., L. Xun, and X. S. Xie. 1998. Single-molecule enzymatic dynamics. Science. 282:1877–1882. - PubMed

Publication types

Substances

LinkOut - more resources