. 2007 Apr;11(4):335-47.
doi: 10.1016/j.ccr.2007.02.006.

HIF-2alpha promotes hypoxic cell proliferation by enhancing c-myc transcriptional activity

Affiliations

HIF-2alpha promotes hypoxic cell proliferation by enhancing c-myc transcriptional activity

John D Gordan et al. Cancer Cell. 2007 Apr.

Abstract

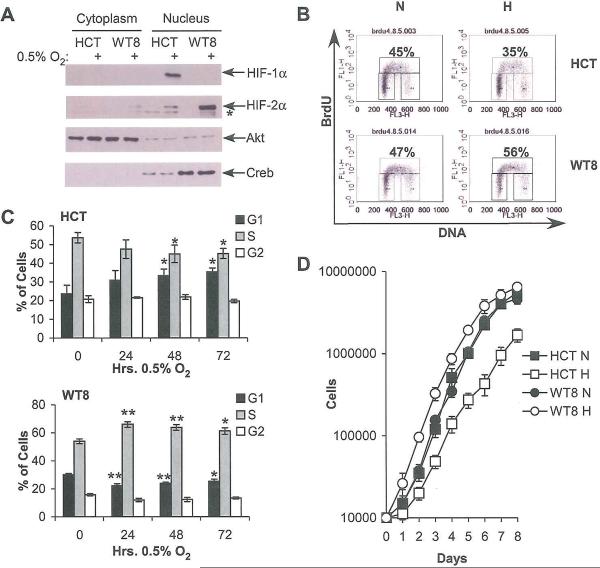
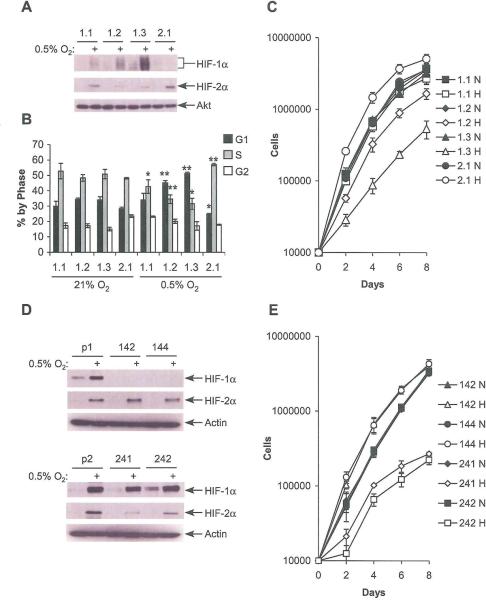
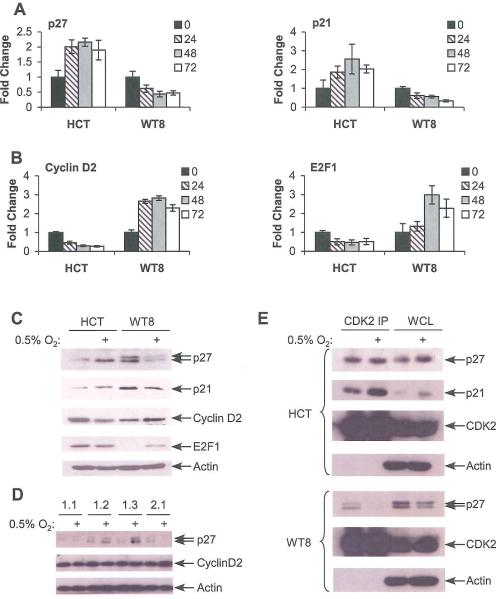
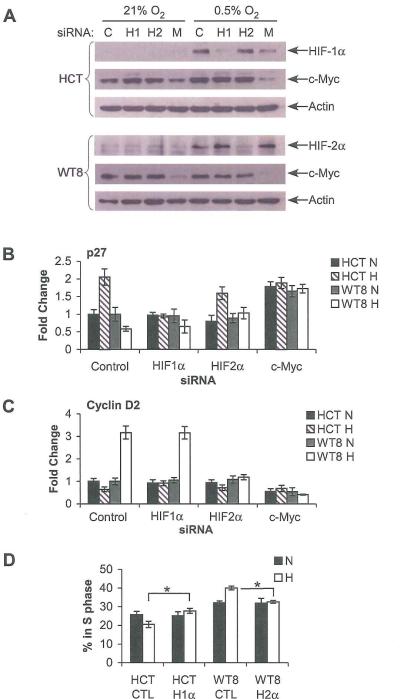
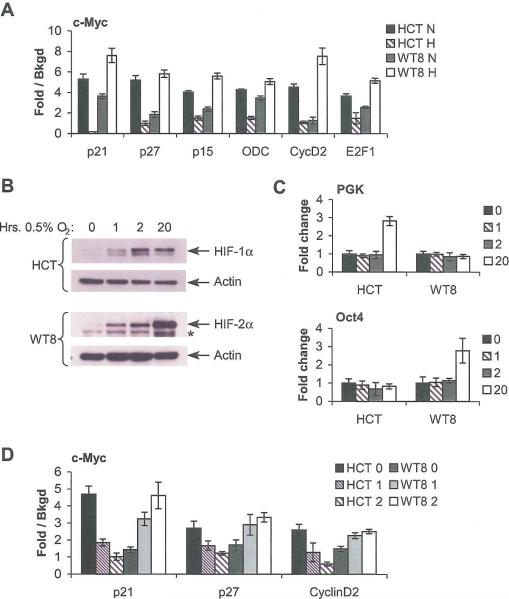
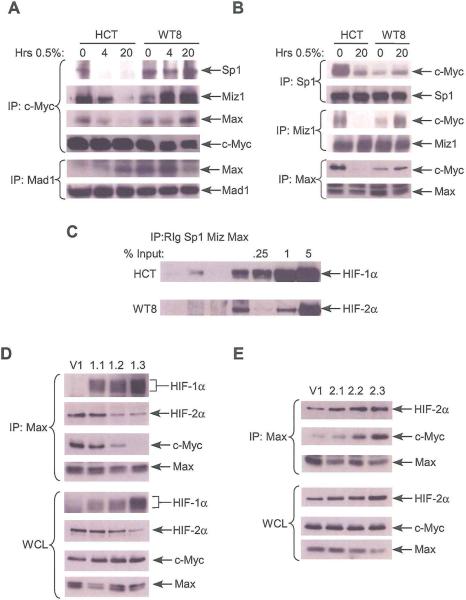
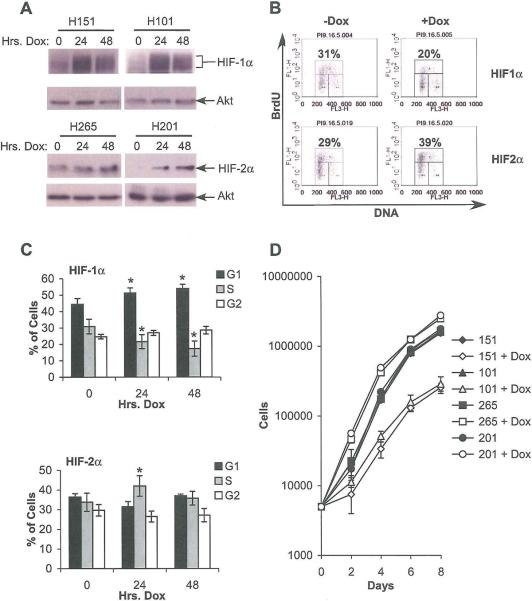
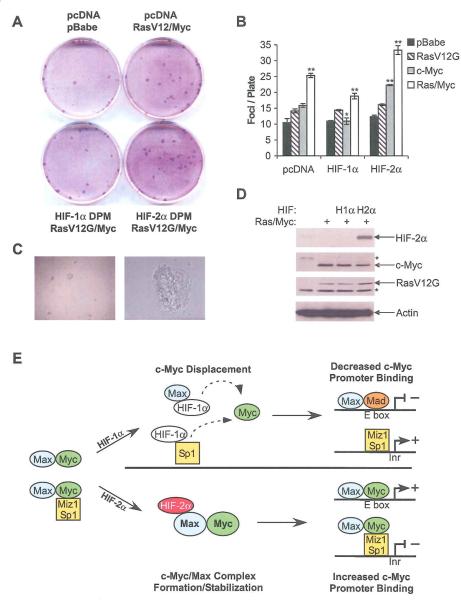
HIF-2alpha promotes von Hippel-Lindau (VHL)-deficient renal clear cell carcinoma (RCC) tumorigenesis, while HIF-1alpha inhibits RCC growth. As HIF-1alpha antagonizes c-Myc function, we hypothesized that HIF-2alpha might enhance c-Myc activity. We demonstrate here that HIF-2alpha promotes cell-cycle progression in hypoxic RCCs and multiple other cell lines. This correlates with enhanced c-Myc promoter binding, transcriptional effects on both activated and repressed target genes, and interactions with Sp1, Miz1, and Max. Finally, HIF-2alpha augments c-Myc transformation of primary mouse embryo fibroblasts (MEFs). Enhanced c-Myc activity likely contributes to HIF-2alpha-mediated neoplastic progression following loss of the VHL tumor suppressor and influences the behavior of hypoxic tumor cells.


Figures

Figure 1
Figure 1
Differential expression of HIF-1α and HIF-2α in HCT116 and WT8 cells correlates with differential cell cycle progression under hypoxia. A. Western blot of HIF-α expression in HCT116 (“FICT”) and WT8 cells following 4 hrs. incubation at 0.5% O2 shows differential expression of HIF-α subunits. Asterisk denotes a background band. Akt and Creb immunoblots assess loading and the efficiency of cellular fractionation; Akt is present in both the nucleus and cytoplasm, while Creb is exclusively nuclear. B. Representative BrdU incorporation plots from HCT116 and WT8 cells grown at 21% or 0.5% O2 for 48 hrs. C. Summary of changes in BrdU incorporation in HCT116 and WT8 cells after 24, 48 and 72 hrs. hypoxia. Results averaged from 3 experiments, error bars ±1 SEM, * p < 0.05, ** p < 0.01. D. Proliferation measured by serial cell counts under normoxia (N) or hypoxia (H); data from one representative experiment. Error ±1 SD.
Figure 2
Figure 2
HIF-1α and HIF-2α have antagonistic effects on cell cycle progression. A. HIF-α subunit expression in WT8 cells stably overexpressing HIF-1α (1.1, 1.2, 1.3) or HIF-2α (2.2) after 24 hrs. at 0.5% O2. B. Summary of changes in BrdU incorporation in WT8 cells overexpressing HIF-1α or HIF-2α after 24 hrs. hypoxia. Results averaged from at least 3 experiments, error bars ±1 SEM, * p < 0.05, ** p < 0.01. C. Proliferation measured by serial cell counts under normoxia (N) or hypoxia (H); data from one representative experiment. Error ±1 SD. D. HIF-α subunit expression in pVHL rescued RCC4 cells transduced with empty vector (p1, p2), shRNA against HFF-1α (142, 144) or HIF-2α (241, 242) after 24 hrs. at 0.5% O2. E. Proliferation in clones with HIF-1α or HIF-2α knockdown, measured by serial cell counts under normoxia (N) or hypoxia (H); data from one representative experiment. Error ±1 SD.
Figure 3
Figure 3
Tumor cell lines expressing HIF-1α or HIF-2α exhibit differential hypoxic effects on cell cycle regulators. A. Expression of c-Myc repressed targets p21 and p27 in HCT116 and WT8 following 24, 48 or 72 hrs. at 0.5% O2. Results measured by QRT-PCR and averaged from 4 experiments, error bars ±1 SEM. As described in the text, HIF-1α expressing HCT116 cells and HIF-2α expressing WT8 cells exhibit opposite responses to hypoxia with respect to c-Myc target expression. B. Expression of c-Myc activated targets Cyclin D2 and E2F1 in HCT116 and WT8 as above. C. Western blot analysis of c-Myc target expression in HCT116 and WT8 following 48 hrs. hypoxia. D. Expression of c-Myc targets in WT8 cells overexpressing HIF-1α or HIF-2α following 24 hrs. at 0.5% O2. E. Change in p21 and p27 interaction with CDK2 assessed by CDK2 IP following 48 hrs. hypoxia in HCT116 and WT8.
Figure 4
Figure 4
HIF-α effects on p27 and Cyclin D2 levels require c-Myc. A. Western blot analysis showing siRNA inhibition of HIF-1α (H1), HIF-2α (H2) and c-Myc (M) expression, as well as a luciferase control (C) in HCT116 and WT8 cells. B. QRT-PCR analysis showing expression of p27 in siRNA treated cells after 20 hrs. at 0.5% O2. Results measured by QRT-PCR from 4 experiments ate shown, error bars ±1 SEM. C. QRT-PCR analysis showing expression of Cyclin D2 in siRNA treated cells. Results measured as above. D. Cell cycle progression measured by BrdU incorporation in asynchronous HCT116 cells treated with control or HIF-1α siRNA and WT8 cells treated with control or HIF-2α siRNA at 21% O2 (N) or 0.5% O2 (H) for 48 hrs. Results averaged from 3 experiments are shown, error bars ±1 SEM, * p < 0.05
Figure 5
Figure 5
ChIP demonstrates altered c-Myc promoter occupancy in hypoxic cells. A. HCT116 and WT8 cells were grown at 21% O2 (N) or 0.5% O2 (H) for 20 hrs., and then assayed by ChIP. Following IP with antibody against c-Myc or isotype control, extracts were assessed by QRT-PCR using SYBR green. The graphs show the fold difference between c-Myc IP and Rabbit IgG control (background) with results from 4 separate experiments, error bars ±1 SEM. B. Time course of HIF-α protein induction in HCT116 and WT8 at 1, 2, and 20 hrs. at 0.5% O2. * indicates a non-specific band. C. QRT-PCR time course of HIF target gene induction at the same time points as above. Results averaged from 3 experiments, error bars ±1 SEM. D. c-Myc promoter binding in HCT116 and WT8 cells incubated at 0.5% O2 for 1 or 2 hrs., then analyzed by ChIP as above. Results from 4 independent experiments are shown, error bars ±1 SEM.
Figure 6
Figure 6
HIF-α effects on c-Myc activity correlate with differential c-Myc interactions with Sp1, Mizl and Max. A. Co-precipitation of Sp1, Mizl, and Max after c-Myc IP and Max after MadI IP in HCT116 and WT8 cells grown at 0.5% O2 for 4 and 20 hrs. B. Co-precipitation of c-Myc after Sp1, Mizl or Max IP in HCT116 and WT8 cells grown under hypoxia for 20 hrs. C. HIF-1α and HIF-2α co-precipitation after Sp1, Mizl, and Max, or isotype control IP in HCT116 and WT8 cells treated DFX for 4 hrs. D. Vector control (V1) and HIF-1α overexpressing cell lines were cultured at 0.5% O2 for 20 hrs. and Max IP was performed and analyzed for co-precipitated HIF-1α, HIF-2α and c-Myc. E. Vector control (V1) and HIF-2α overexpressing cell lines were cultured at 0.5% O2 for 20 hrs. and Max IP was performed and analyzed for co-precipitated HIF-2α and c-Myc.
Figure 7
Figure 7
Doxycycline-regulated NIH3T3 cells expressing normoxically stable HIF-1α or HIF-2α show differential effects on cell cycle progression. A. Western blots showing HIF-α subunit expression following 24 or 48 hrs. treatment with doxycycline. B. Representative FACS plot at 0 and 2 days doxycycline from a HIF-1α (151) and HIF-2α (201) expressing clone. C. Cell cycle progression in doxycycline-regulated 3T3s (clones 151 and 201) measured by BrdU incorporation. Results from 3 experiments are shown, error bars ±1 SEM, * p < 0.05. D. Proliferation measured by serial cell counts; data from one representative experiment. Error ±1 SD.
Figure 8
Figure 8
HIF-2α promotes focus formation by primary MEFs. A. Representative Wright-Giemsa stained plates from MEFs transfected with empty pcDNA3.1 and pBABE vectors, RasV12G, c-Myc, DPM-HIF-1α and DPM-HIF-2α. B. Colony counts from all transfection combinations are shown. Results from 3 experiments, error bars ±1 SEM, * p < 0.05, ** p < 0.01. C. Colony formation in soft agar by cell lines derived from foci. 20× and 1OO× magnifications are shown. D. Immunoblot analysis of HIF-2α, c-Myc and Ras overexpression in representative clones obtained from foci picked from plates transfected c-Myc, RasV12G, and pCDNA3.1, DPM-HIF-1α and DPM-HIF-2α. * indicates endogenous protein. E. Model for HIF-α regulation of c-Myc activity. We propose that HIF-1α specifically disrupts c-Myc/Max and c-Myc/Sp1 complexes, allowing more Mad/Max interaction and DNA binding. On the other hand, we hypothesize that HIF-2α stabilizes c-Myc/Max complexes, in turn promoting c-Myc DNA binding at both E boxes and Inrs.

References

    1. Acker T, Diez-Juan A, Aragones J, Tjwa M, Brusselmans K, Moons L, Fukumura D, Moreno-Murciano MP, Herbert JM, Burger A, et al. Genetic evidence for a tumor suppressor role of HIF-2alpha. Cancer Cell. 2005;8:131–141. - PubMed
    1. Adhikary S, Eilers M. Transcriptional regulation and transformation by Myc proteins. Nat Rev Mol Cell Biol. 2005;6:635–645. - PubMed
    1. Alt JR, Cleveland JL, Hannink M, Diehl JA. Phosphorylation-dependent regulation of cyclin D1 nuclear export and cyclin D1-dependent cellular transformation. Genes Dev. 2000;14:3102–3114. - PMC - PubMed
    1. Baba M, Hirai S, Yamada-Okabe H, Hamada K, Tabuchi H, Kobayashi K, Kondo K, Yoshida M, Yamashita A, Kishida T, et al. Loss of von Hippel-Lindau protein causes cell density dependent deregulation of Cyclin D1 expression through hypoxia-inducible factor. Oncogene. 2003;22:2728–2738. - PubMed
    1. Bouchard C, Thieke K, Maier A, Saffrich R, Hanley-Hyde J, Ansorge W, Reed S, Sicinski P, Bartek J, Eilers M. Direct induction of cyclin D2 by Myc contributes to cell cycle progression and sequestration of p27. Embo J. 1999;18:5321–5333. - PMC - PubMed

Publication types

MeSH terms

Substances