. 2007 Apr;11(4):349-60.
doi: 10.1016/j.ccr.2007.02.015.

The differentiation and stress response factor XBP-1 drives multiple myeloma pathogenesis

Affiliations

The differentiation and stress response factor XBP-1 drives multiple myeloma pathogenesis

Daniel R Carrasco et al. Cancer Cell. 2007 Apr.

Abstract

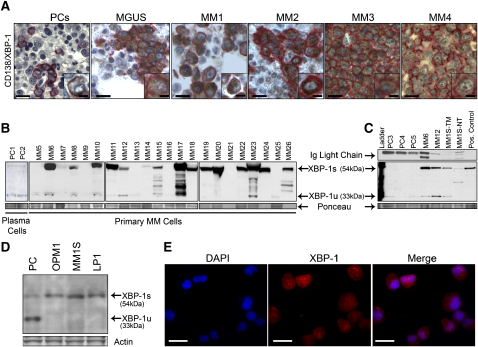
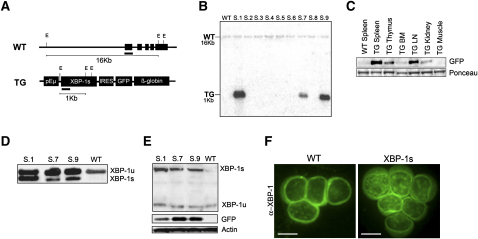
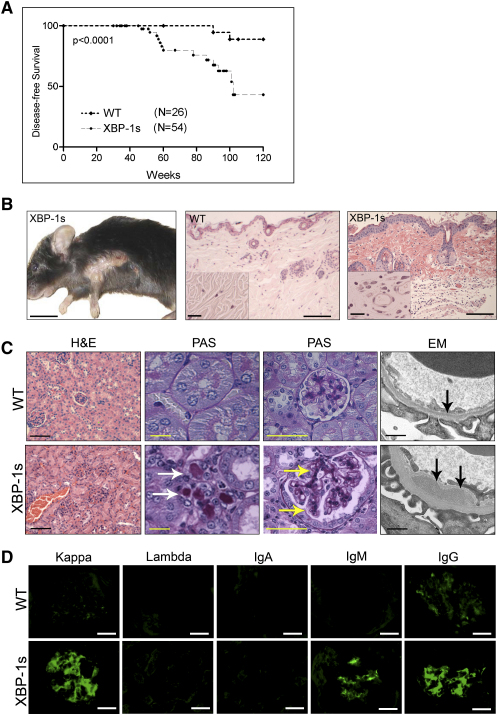
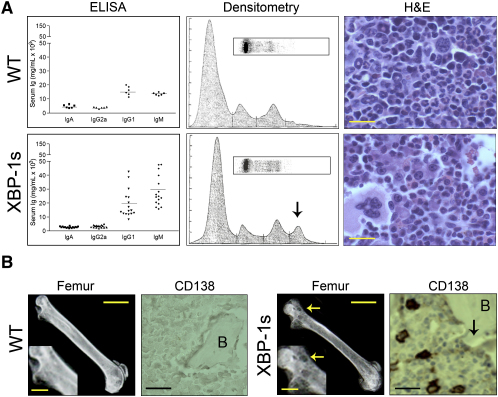
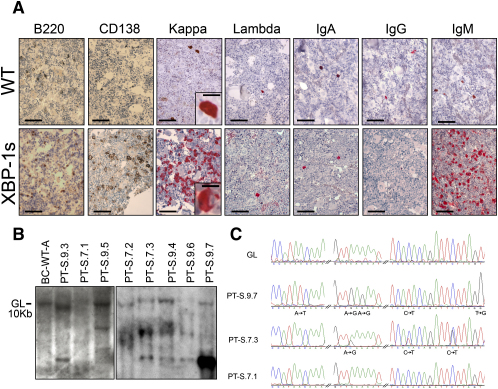
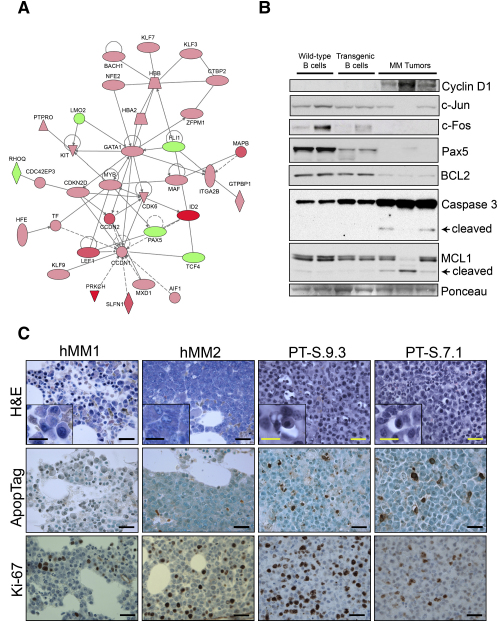
Multiple myeloma (MM) evolves from a highly prevalent premalignant condition termed MGUS. The factors underlying the malignant transformation of MGUS are unknown. We report a MGUS/MM phenotype in transgenic mice with Emu-directed expression of the XBP-1 spliced isoform (XBP-1s), a factor governing unfolded protein/ER stress response and plasma-cell development. Emu-XBP-1s elicited elevated serum Ig and skin alterations. With age, Emu-xbp-1s transgenics develop features diagnostic of human MM, including bone lytic lesions and subendothelial Ig deposition. Furthermore, transcriptional profiles of Emu-xbp-1s lymphoid and MM cells show aberrant expression of known human MM dysregulated genes. The similarities of this model with the human disease, coupled with documented frequent XBP-1s overexpression in human MM, serve to implicate XBP-1s dysregulation in MM pathogenesis.


Figures

Figure 1
Figure 1
Predominance of the Spliced Form of XBP-1 over the Unspliced Form in MM Primary Tumors (A) Immunohistochemical analysis for XBP-1 expression was performed on bone marrow tissue microarrays from healthy (PCs) donors (n = 10) and MGUS (n = 20) and MM (n = 70) patients. Representative results are shown. CD138 is stained in red, and XBP-1 is stained in brown. Scale bars, 50 μm (10 μm in insets). (B) Plasma cells were isolated from the bone marrow of healthy donors (lanes 1 and 2) and MM primary tumors (lanes 3–24) using CD138 magnetic beads, and total protein extract (40 μg per lane) was subjected to western blot analysis using anti-XBP-1 antibodies. (C)Total protein extract (20 μg) from CD138 purified normal plasma cells (PC), MM primary tumors (MM), the MM1S MM cell line treated with 10 μg/ml of Tunicamycin (TM) and untreated (NT) for 4 hr, and 293T cells lentivirally infected with XBP-1s (Pos. Control) were electrophoresed and subjected to western blot analysis using XBP-1 antibodies. Protein loading was assessed by Ponceau staining and Ig light-chain immunostaining. (D) Total protein extracts (40 μg per lane) from CD138-purified normal plasma cells (PC) and MM cell lines were subjected to western blot analysis using XBP-1 antibodies. (E) Immunofluorescence analysis of XBP-1 expression on MM1S cell line. Scale bars, 50 μm.
Figure 2
Figure 2
Generation and Characterization of Eμ-xbp-1s Transgenic Mice (A) Transgenic construct. The xbp-1s cDNA encoding the spliced form of mouse XBP-1 was cloned downstream of the immunoglobulin VH promoter and Eμ enhancer (pEμ) elements. In addition to expressing XBP-1s, the transgene also encodes a farnesylated eGFP coding sequence behind an IRES element. (B) Southern blot genotyping of Eμ-xbp-1s transgenic mice was done on EcoRI-digested genomic tail DNA and hybridized with a radiolabeled probe encoding 5′ sequences from the mouse xbp-1s cDNA. Note genomic xbp-1 sequences (WT) as well as transgenic sequences (TG). Only three of nine founders are shown. (C) High levels of transgene expression in spleen, lymph nodes, and thymus as evaluated by eGFP western blot analysis on total organ protein extracts isolated from 6-week-old control and transgenic mice. (D) RT-PCR analysis using mRNA from purified mouse B cells from Eμ-xbp-1s transgenic (S.1, S.7, S.9) and control (WT) mice. The 171 bp and 145 bp DNA fragments correspond to unspliced and spliced xbp-1 mRNAs, respectively. (E) Western blot analysis of Eμ-xbp-1s transgenic (S.1, S.7, and S.9) and control (WT) splenic B220+ B cells. (F) Immunofluorescence staining of control (WT) and Eμ-xbp-1s transgenic splenic B cells. Scale bars, 10 μm. The genomic DNA, mRNA, and protein extracts were isolated from 6-week-old transgenic and control littermates.
Figure 3
Figure 3
Survival, Skin, and Renal Alterations in Eμ-xbp-1s Transgenic Mice (A) Disease-free survival (lack of skin alterations) in Eμ-xbp-1s transgenic mice. Statistically significant differences (p < 0.0001) were detected between Eμ-xbp-1s transgenic and control littermates. (B) Skin alterations in Eμ-xbp-1s transgenic mice. Note loss of hair and skin thickening in axillary region. Histological H&E sections showing dermal changes in Eμ-xbp-1s transgenic mice. Note epidermal thickening, dermal fibrosis, and vascular proliferation (insets). Scale bars, 1.0 cm (left panel), 50 μm (middle and left panels), and 20 μm (insets). (C) Renal tissue sections from 40-week-old control (WT) and Eμ-xbp-1s transgenic mice were stained with H&E, PAS, or subjected to electron microscopic analysis (EM). White arrows, tubular protein deposition; yellow arrows, mesangial protein deposition; black arrows, subendothelial deposits. Scale bars, 50 μm (H&E), 20 μm (PAS), 0.1 μm (EM). (D) Glomerular immunoglobulin deposition. Serial frozen renal sections from control (WT) and Eμ-xbp-1s tissue sections were analyzed by immunofluorescence using specific antibodies for mouse immunoglobulin kappa and lambda light chains, as well as IgA, IgG, and IgM heavy chains. Scale bars, 20 μm.
Figure 4
Figure 4
Hypergammaglobulinemia, Bone Marrow Plasmacytic Infiltrates, and Bone Lytic Lesions in Eμ-xbp-1s Transgenic Mice (A) Marked elevation of serum immunoglobulin levels in Eμ-xbp-1s transgenic mice. Serum plasma from control (WT) and Eμ-xbp-1s transgenic mice were measured by ELISA, protein serum electrophoresis, and densitometry. Note the presence of M spike (arrow) in Eμ-xbp-1s transgenic mice. Representative bone marrow biopsies from control and Eμ-xbp-1s transgenic mice were analyzed by light microscopy (H&E) to reveal increased plasma-cell infiltrates in the marrow of Eμ-xbp-1s transgenic mice. (B) Bone lytic lesions in Eμ-xbp-1s transgenic mice. Femurs from control (WT) and Eμ-xbp-1s transgenic mice were dissected to detect the presence of bone lytic lesions by X-ray (white arrows) and immunohistochemical analysis (black arrow). B, cortical bone. Scale bars 20 μm (upper panel), 0.5 cm (lower panels, femur), 0.25 cm (insets), 50 μm (CD138).
Figure 5
Figure 5
Evidence of Clonality and Hypermutation of Expressed Ig Genes in Eμ-xbp-1s Transgenic Mice (A) IHC analysis of plasma-cell clonality from bone marrow biopsies. Scale bars, 50 μm (10 μm in insets). (B) Southern blot analysis for clonotypic immunoglobulin heavy-chain rearrangement in Eμ-xbp-1s myeloma tumors. High-molecular-weight DNA was isolated from snap-frozen control or myeloma marrows, digested with EcoRI restriction enzyme, and hybridized with a  1.9 BamHI-EcoRI genomic probe fragment downstream and adjacent to the mouse heavy-chain locus JH segment. GL denotes the germline band. (C) DNA sequence chromatograms of PCR products detect mutations in the 3′ JH4 region of rearranged variable (V) genes in Eμ-xbp-1s tumors.
Figure 6
Figure 6
Altered Gene Expression of Eμ-xbp-1s B Cells and Tumor Plasma Cells and Increased Apoptosis of Tumor Plasma Cells (A) Ingenuity analysis showing altered expression of Cyclin D1 and c-MAF in myeloma tumors. In red are significantly overexpressed genes and in green are downregulated genes. Color intensity is proportional to the SAM score (Tusher et al., 2001). (B) Western blot analysis showing activation of caspase-3, as well as decreased c-JUN, c-FOS, MCL1, and BCL2 in transgenic B cells and MM tumors as compared to wild-type samples. (C) IHC showing increased apoptosis (Apoptag) and proliferation index (Ki-67) in Eμ-xbp-1s myeloma primary mouse tumors (PT) as compared with human myeloma tumors (hMM). Scale bars, 50 μm (20 μm in insets).

Similar articles

Cited by

References

    1. Bergsagel P.L., Kuehl W.M. Molecular pathogenesis and a consequent classification of multiple myeloma. J. Clin. Oncol. 2005;23:6333–6338. - PubMed
    1. Calfon M., Zeng H., Urano F., Till J.H., Hubbard S.R., Harding H.P., Clark S.G., Ron D. IRE1 couples endoplasmic reticulum load to secretory capacity by processing the XBP-1 mRNA. Nature. 2002;415:92–96. - PubMed
    1. Calvano S.E., Xiao W., Richards D.R., Felciano R.M., Baker H.V., Cho R.J., Chen R.O., Brownstein B.H., Cobb J.P., Tschoeke S.K. A network-based analysis of systemic inflammation in humans. Nature. 2005;437:1032–1037. - PubMed
    1. Carrasco D., Tonon G., Huang Y., Zhang Y., Sinha R., Feng B., Zhan F., Khatry D., Protopopova M., Protopopov A. High-resolution genomic profiles define distinct clinico-pathogenetic subgroups of multiple myeloma patients. Cancer Cell. 2006;9:313–325. - PubMed
    1. Cheung W.C., Kim J.S., Linden M., Peng L., Van Ness B., Polakiewicz R.D., Janz S. Novel targeted deregulation of c-Myc cooperates with Bcl-X(L) to cause plasma cell neoplasms in mice. J. Clin. Invest. 2004;113:1763–1773. - PMC - PubMed

Publication types

MeSH terms

Associated data