. 2007 Jun;84(6):1090-103.
doi: 10.1016/j.exer.2007.02.007. Epub 2007 Feb 16.

Functional and molecular characterization of multiple K-Cl cotransporter isoforms in corneal epithelial cells

Affiliations

Functional and molecular characterization of multiple K-Cl cotransporter isoforms in corneal epithelial cells

José E Capó-Aponte et al. Exp Eye Res. 2007 Jun.

Abstract

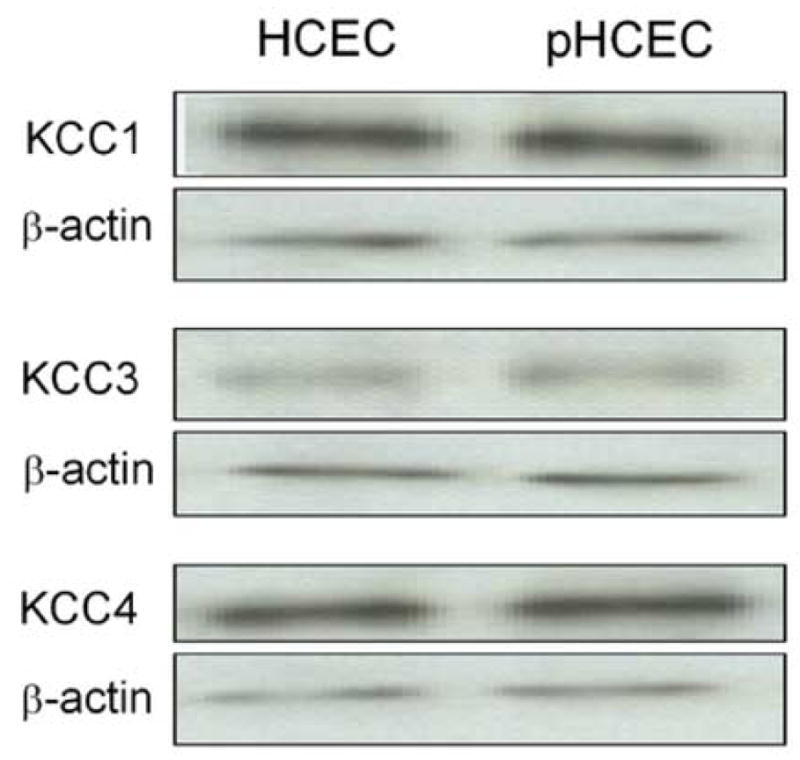
The dependence of regulatory volume decrease (RVD) activity on potassium-chloride cotransporter (KCC) isoform expression was characterized in corneal epithelial cells (CEC). During exposure to a 50% hypotonic challenge, the RVD response was larger in SV40-immortalized human CEC (HCEC) than in SV40-immortalized rabbit CEC (RCEC). A KCC inhibitor-[(dihydroindenyl)oxy] alkanoic acid (DIOA)-blocked RVD more in HCEC than RCEC. Under isotonic conditions, N-ethylmaleimide (NEM) produced KCC activation and transient cell shrinkage. Both of these changes were greater in HCEC than in RCEC. Immunoblot analysis of HCEC, RCEC, primary human CEC (pHCEC), and primary bovine CEC (BCEC) plasma membrane enriched fractions revealed KCC1, KCC3, and KCC4 isoform expression, whereas KCC2 was undetectable. During a hypotonic challenge, KCC1 membrane content increased more rapidly in HCEC than in RCEC. Such a challenge induced a larger increase and more transient p44/42MAPK activation in HCEC than RCEC. On the other hand, HCEC and RCEC p38MAPK phosphorylation reached peak activations at 2.5 and 15 min, respectively. Only in HCEC, pharmacological manipulation of KCC activity modified the hypotonicity-induced activation of p44/42MAPK, whereas p38MAPK phosphorylation was insensitive to such procedures in both cell lines. Larger increases in HCEC KCC1 membrane protein content correlated with their ability to undergo faster and more complete RVD. Furthermore, pharmacological activation of KCC increased p44/42MAPK phosphorylation in HCEC but not in RCEC, presumably a reflection of low KCC1 membrane expression in RCEC. These findings suggest that KCC1 plays a role in (i) maintaining isotonic steady-state cell volume homeostasis, (ii) recovery of isotonic cell volume after a hypotonic challenge through RVD, and (iii) regulating hypotonicity-induced activation of the p44/42MAPK signaling pathway required for cell proliferation.


Figures

Fig. 1
Fig. 1
KCC contributes to RVD. After initial exposure to 300 mOsm isotonic solution (A) HCEC, pHCEC, and (B) RCEC were exposed to 150 mOsm hypotonic challenge in the presence or absence of the KCC inhibitor DIOA (100 μM). Data are presented as mean ± SEM (n = 6). Error bars are not shown when smaller than the symbols. C: Summary of the volume recovery (%) of HCEC and RCEC. *p < 0.001 versus untreated cells during hypotonic challenge.
Fig. 2
Fig. 2
KCC participates in steady-state volume homeostasis. After initial exposure to isotonic conditions, (A) HCEC and (B) RCEC were exposed to the following reagents added in isotonic solution: 100 μM DIOA, 1 mM NEM, and NEM after 30 min pre-treatment with DIOA. Untreated cells in isotonic solution are shown for comparison. Summary of the maximum volume change (%) in (C) HCEC and (D) RCEC induced by above reagents. Data are presented as mean ± SEM (n = 7). Error bars are not shown when smaller than the symbols. *p < 0.001; ** p< 0.05 versus untreated isotonic controls.
Fig. 3
Fig. 3
CEC express multiple KCC isoforms. Representative Western blot of HCEC (H), RCEC (R), and BCEC (B) membrane fractions loaded onto a 7.5% SDS gel at 24 or 12 μg per lane, as noted. The separated proteins were transferred to PVDF membranes and probed with polyclonal antibody (1:500) against (A) KCC1, (B) KCC3, or (C) KCC4. Blots were stripped and reprobed with β-actin antibody to compare protein loading. Summary of the differential expression levels of each KCC isoform in CEC is displayed in the lower panels, expressed as arbitrary units. Error bars are not shown when smaller than the symbols. Data are presented as the mean ± SEM of three independent experiments. *p < 0.001; **p < 0.05.
Fig. 4
Fig. 4
KCC2 isoform is not expressed in CEC. Representative blot of three independent Western blot analyses of various brain and corneal epithelium preparations. Fifty μg of protein per lane of mouse brain (M), rat brain (Rt), HCEC (H), RCEC (R), and BCEC (B) were loaded onto a 7.5% SDS gel, as indicated. Polyclonal antibody against KCC2 (1:500) identified the presence of KCC2 in brain extracts but failed to detect KCC2 in CEC preparations.
Fig. 5
Fig. 5
HCEC and pHCEC express similar levels of KCC isoforms. Representative images of three independent Western blots of HCEC and pHCEC membrane fractions loaded onto a 7.5% SDS gel (50 μg per lane). The separated proteins were transferred to PVDF membranes and probed with polyclonal antibody (1:500) against KCC1, KCC3, or KCC4.
Fig. 6
Fig. 6
Time-dependent changes of KCC1 membrane content induced by hypotonic stress. Representative Western blot and summary of hypotonicity-induced changes in KCC1 membrane content of (A) HCEC and (B) RCEC. Cells were exposed to isotonic solution or 50% hypotonic challenge for the indicated times. Membrane content of KCC1 is presented as fold change to isotonic control. Data are presented as mean ± SEM of three independent experiments. *p < 0.001; **p < 0.05.
Fig. 7
Fig. 7
Time-dependent changes of KCC3 membrane content induced by hypotonic stress. Representative Western blot and summary of hypotonicity-induced changes in KCC3 membrane content of (A) HCEC and (B) RCEC. Cells were exposed to isotonic solution or 50% hypotonic challenge for the indicated times. Membrane content of KCC3 is presented as fold change to isotonic control. Data are presented as mean ± SEM of three independent experiments.
Fig. 8
Fig. 8
Time-dependent changes of KCC4 membrane content induced by hypotonic stress. Representative Western blot and summary of hypotonicity-induced changes in KCC4 membrane content of (A) HCEC and (B) RCEC. Cells were exposed to isotonic solution or 50% hypotonic challenge for the indicated times. Membrane content of KCC4 is presented as fold change to isotonic control. Data are presented as mean ± SEM of three independent experiments.
Fig. 9
Fig. 9
Time-dependent changes in p44/42MAPK phosphorylation induced by hypotonic stress. (A) HCEC and (B) RCEC were serum-starved for 24 h at 80–90% confluence and exposed to 50% hypotonic challenge for the indicated times. Samples were loaded onto a 10% SDS gel. Representative Western blots of membranes probed with anti-phospho-p44/42MAPK antibody (upper panels) and summary of time-dependent changes in p44/42MAPK phosphorylation status (lower panels), expressed as fold change to isotonic control. Data shown as mean ± SEM of three independent experiments.
Fig. 10
Fig. 10
Time-dependent changes in p38MAPK phosphorylation induced by hypotonic stress. (A) HCEC and (B) RCEC were serum-starved for 24 h at 80–90% confluence and exposed to 50% hypotonic challenge for the indicated times. Samples were loaded onto a 10% SDS gel. Representative Western blots of membranes probed with anti-phospho- p38MAPK antibody (upper panels) and summary of time-dependent changes in p38MAPK phosphorylation status (lower panels), expressed as fold change to isotonic control. Data shown as mean ± SEM of three independent experiments.
Fig. 11
Fig. 11
KCC role on hypotonicity-induced p44/42MAPK phosphorylation. HCEC (A) and (B) RCEC were serum-starved for 24 h and exposed to either 100 μM DIOA, 10 μM U0126 (U0), 10μM SB203580 (SB), 10 μM PD98059 (PD), or 30 μM genistein (Gen) for 30 min. Subsequently, HCEC and RCEC were exposed to 150 mOsm hypotonic challenge for 2.5 and 5 min, respectively, in the continuous presence of the same inhibitors. Control cells were maintained in isotonic solution, whereas KCC activation was achieved by NEM (1 mM) addition under isotonic conditions. A representative blot shows the phosphorylation status of p44/42MAPK using a specific monoclonal antibody (upper panels) and summary of p44/42MAPK phosphorylation status of three independent experiments (lower panel). Data are shown as mean ± SEM.
Fig. 12
Fig. 12
Role of KCC in hypotonicity-induced p38MAPK phosphorylation. HCEC (A) and (B) RCEC were serum-starved for 24 h and exposed to either 100 μM DIOA, 10 μM U0126 (U0), 10μM SB203580 (SB), 10 μM PD98059 (PD), or 30 μM genistein (Gen) for 30 min. Subsequently, HCEC and RCEC were exposed to 150 mOsm hypotonic challenge for 2.5 and 5 min, respectively, in the continuous presence of the same inhibitors. Control cells were maintained in isotonic solution, whereas KCC activation was achieved by NEM (1 mM) addition under isotonic conditions. A representative blot shows the phosphorylation status of p38MAPK using a specific monoclonal antibody (upper panels) and summary of p38MAPK phosphorylation status of three independent experiments (lower panel). Data are shown as mean ± SEM.

References

    1. Adragna NC, Ferrell CM, Zhang J, Di Fulvio M, Temprana CF, Sharma A, Fyffe RE, Cool DR, Lauf PK. Signal transduction mechanisms of K+-Cl− cotransport regulation and relationship to disease. Acta Physiol (Oxf) 2006;187:125–139. - PubMed
    1. Adragna NC, Fulvio MD, Lauf PK. Regulation of K-Cl cotransport: from function to genes. J Membr Biol. 2004;201:109–137. - PubMed
    1. Al-Nakkash L, Iserovich P, Coca-Prados M, Yang H, Reinach PS. Functional and molecular characterization of a volume-activated chloride channel in rabbit corneal epithelial cells. J Membr Biol. 2004;201:41–49. - PubMed
    1. Al-Nakkash L, Reinach PS. Activation of a CFTR-mediated chloride current in a rabbit corneal epithelial cell line. Invest Ophthalmol Vis Sci. 2001;42:2364–2370. - PubMed
    1. Araki K, Ohashi Y, Sasabe T, Kinoshita S, Hayashi K, Yang XZ, Hosaka Y, Aizawa S, Handa H. Immortalization of rabbit corneal epithelial cells by a recombinant SV40-adenovirus vector. Invest Ophthalmol Vis Sci. 1993;34:2665–2671. - PubMed

Publication types