

Membrane hemifusion is a stable intermediate of exocytosis
- PMID: 17420001
- PMCID: PMC1989768
- DOI: 10.1016/j.devcel.2007.02.007
Membrane hemifusion is a stable intermediate of exocytosis
Erratum in
- Dev Cell. 2007 May;12(5):837-8
Abstract
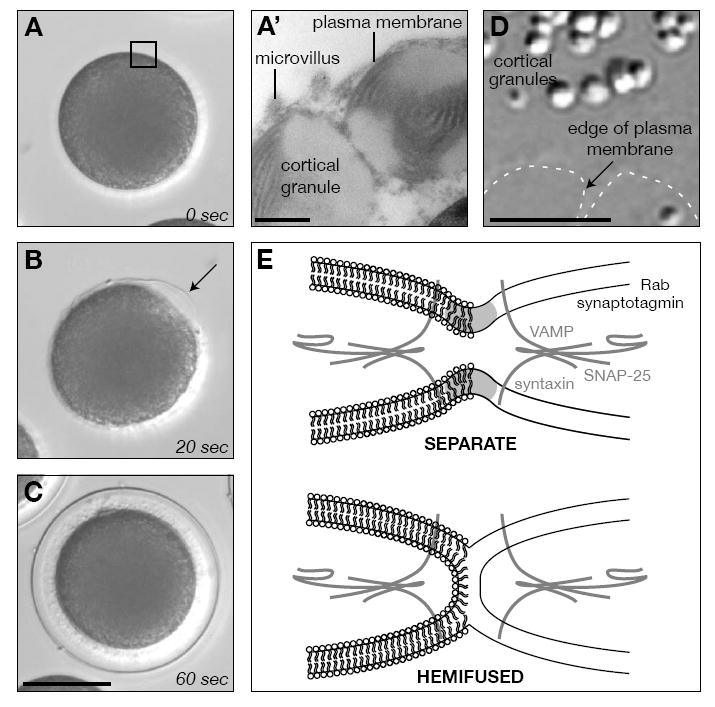
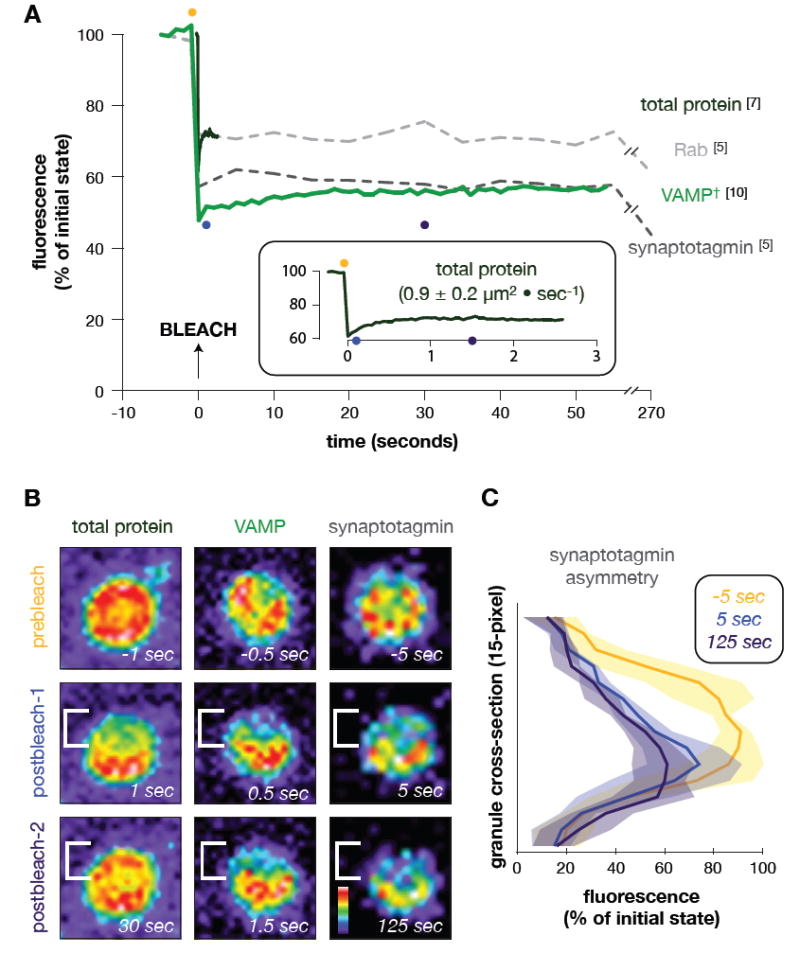
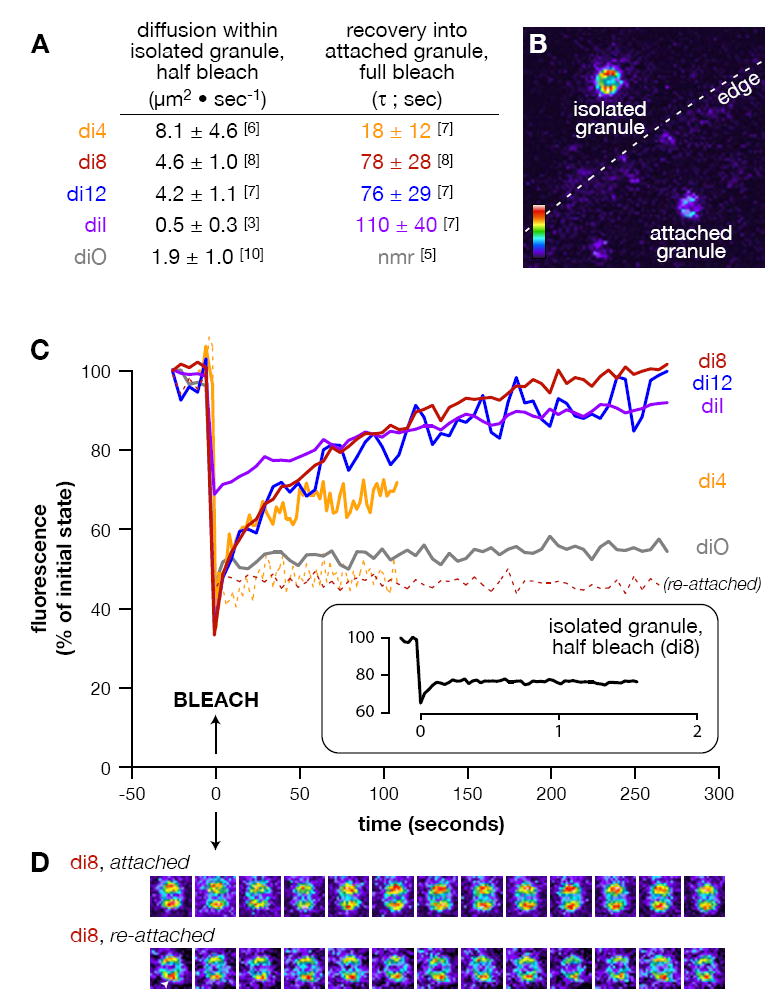
Membrane fusion during exocytosis requires that two initially distinct bilayers pass through a hemifused intermediate in which the proximal monolayers are shared. Passage through this intermediate is an essential step in the process of secretion, but is difficult to observe directly in vivo. Here we study membrane fusion in the sea urchin egg, in which thousands of homogeneous cortical granules are associated with the plasma membrane prior to fertilization. Using fluorescence redistribution after photobleaching, we find that these granules are stably hemifused to the plasma membrane, sharing a cytoplasmic-facing monolayer. Furthermore, we find that the proteins implicated in the fusion process-the vesicle-associated proteins VAMP/synaptobrevin, synaptotagmin, and Rab3-are each immobile within the granule membrane. Thus, these secretory granules are tethered to their target plasma membrane by a static, catalytic fusion complex that maintains a hemifused membrane intermediate.
Figures
Similar articles
-
Members of the SNARE hypothesis are associated with cortical granule exocytosis in the sea urchin egg.Mol Reprod Dev. 1997 Sep;48(1):106-18. doi: 10.1002/(SICI)1098-2795(199709)48:1<106::AID-MRD13>3.0.CO;2-Z. Mol Reprod Dev. 1997. PMID: 9266767
-
rab3 mediates cortical granule exocytosis in the sea urchin egg.Dev Biol. 1998 Nov 15;203(2):334-44. doi: 10.1006/dbio.1998.9057. Dev Biol. 1998. PMID: 9808784
-
High cholesterol obviates a prolonged hemifusion intermediate in fast SNARE-mediated membrane fusion.Biophys J. 2015 Jul 21;109(2):319-29. doi: 10.1016/j.bpj.2015.06.022. Biophys J. 2015. PMID: 26200867 Free PMC article.
-
Membrane hemifusion: crossing a chasm in two leaps.Cell. 2005 Nov 4;123(3):375-82. doi: 10.1016/j.cell.2005.10.015. Cell. 2005. PMID: 16269330 Review.
-
Regulated exocytosis and SNARE function (Review).Mol Membr Biol. 2003 Jul-Sep;20(3):209-20. doi: 10.1080/0968768031000104953. Mol Membr Biol. 2003. PMID: 12893529 Review.
Cited by
-
Magnesium-induced lipid bilayer microdomain reorganizations: implications for membrane fusion.J Phys Chem B. 2009 Jul 23;113(29):9932-41. doi: 10.1021/jp9011944. J Phys Chem B. 2009. PMID: 19603842 Free PMC article.
-
Highly Efficient Protein-free Membrane Fusion: A Giant Vesicle Study.Biophys J. 2019 Jan 8;116(1):79-91. doi: 10.1016/j.bpj.2018.11.3128. Epub 2018 Dec 1. Biophys J. 2019. PMID: 30579564 Free PMC article.
-
Supramolecular SNARE assembly precedes hemifusion in SNARE-mediated membrane fusion.Nat Struct Mol Biol. 2008 Jul;15(7):700-6. doi: 10.1038/nsmb.1433. Epub 2008 Jun 15. Nat Struct Mol Biol. 2008. PMID: 18552827 Free PMC article.
-
Contribution of cryoelectron microscopy of vitreous sections to the understanding of biological membrane structure.Proc Natl Acad Sci U S A. 2012 Jun 5;109(23):8959-64. doi: 10.1073/pnas.1200881109. Epub 2012 May 21. Proc Natl Acad Sci U S A. 2012. PMID: 22615384 Free PMC article.
-
The fusion pores of Ca2+ -triggered exocytosis.Nat Struct Mol Biol. 2008 Jul;15(7):684-9. doi: 10.1038/nsmb.1449. Epub 2008 Jul 3. Nat Struct Mol Biol. 2008. PMID: 18596819 Free PMC article. Review.
References
Publication types
MeSH terms
Substances
Grants and funding
LinkOut - more resources
Full Text Sources
Other Literature Sources
Miscellaneous
