. 2007 May;17(5):594-601.
doi: 10.1101/gr.6096207. Epub 2007 Apr 9.

The mode and tempo of genome size evolution in eukaryotes

Affiliations

The mode and tempo of genome size evolution in eukaryotes

Matthew J Oliver et al. Genome Res. 2007 May.

Erratum in

  • Genome Res. 2010 Jun;20(6):874

Abstract

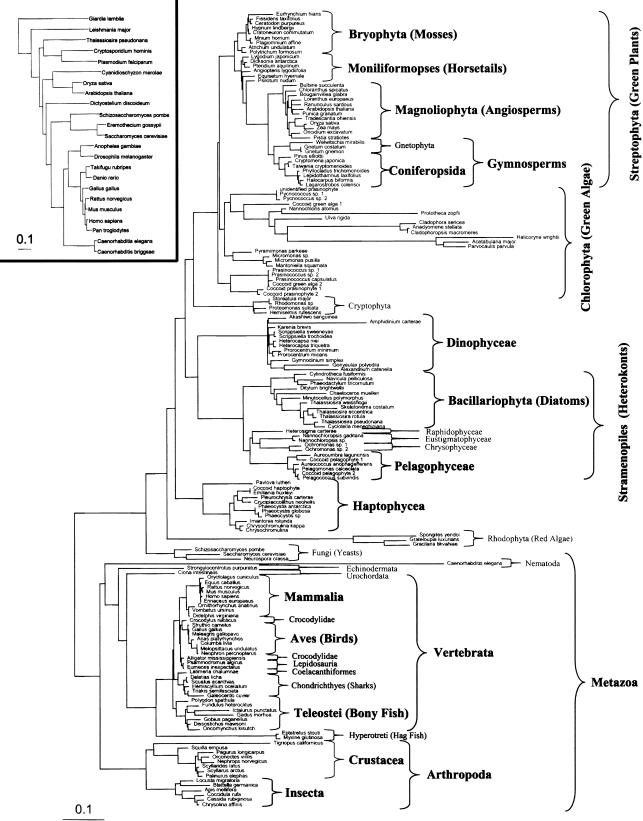
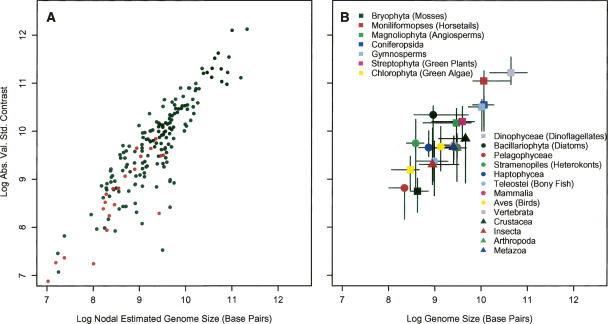
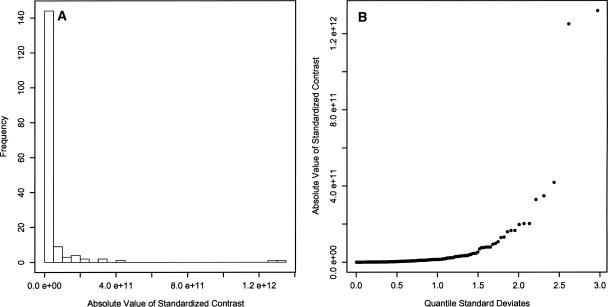
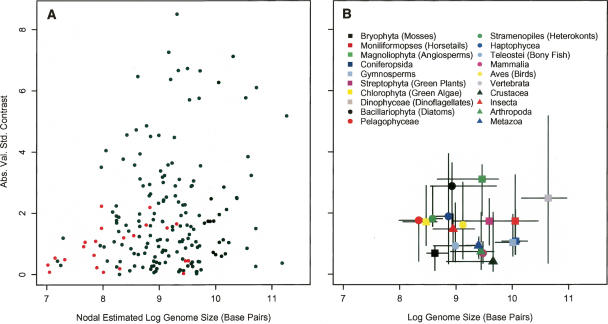
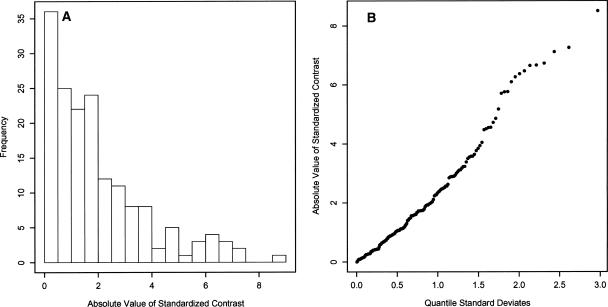
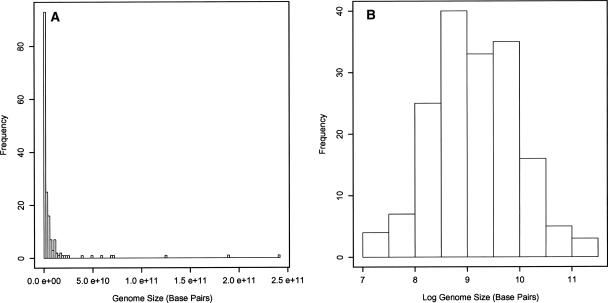
Eukaryotic genome size varies over five orders of magnitude; however, the distribution is strongly skewed toward small values. Genome size is highly correlated to a number of phenotypic traits, suggesting that the relative lack of large genomes in eukaryotes is due to selective removal. Using phylogenetic contrasts, we show that the rate of genome size evolution is proportional to genome size, with the fastest rates occurring in the largest genomes. This trend is evident across the 20 major eukaryotic clades analyzed, indicating that over long time scales, proportional change is the dominant and universal mode of genome-size evolution in eukaryotes. Our results reveal that the evolution of eukaryotic genome size can be described by a simple proportional model of evolution. This model explains the skewed distribution of eukaryotic genome sizes without invoking strong selection against large genomes.


Figures

Figure 1.
Figure 1.
Maximum likelihood tree based on 18S rDNA sequences built using PHYML. Taxonomic groups highlighted in bold were analyzed for genome size evolution. Accession numbers for the 18S rDNA sequences used in this analysis are given in Supplemental Table 1. (Inset) Alternative eukaryotic tree based on 31 orthologs that was used to verify the general trend of genome size evolution inferred from the 18S rDNA tree (Ciccarelli et al. 2006).
Figure 2.
Figure 2.
(A) A tree-wise analysis of the nodal estimated genome size and the calculated contrast at each node from the 18S rDNA tree (black dots) and the 31-ortholog tree (red dots). Estimations from both trees indicate that as genome size increases, the rate of evolution of genome size increases (shown on Log10 axes for plotting purposes). (B) Distribution of the median absolute contrast and the median genome size of the 20 traditionally recognized taxonomic groups from the 18S rDNA tree. Bars represent bootstrapped 95% confidence intervals. Again, a clear positive relationship is evident between genome size and the rate of genome size evolution (shown on Log10 axes for plotting purposes).
Figure 3.
Figure 3.
(A) Distribution of the absolute value of the standardized contrasts from the 18S rDNA tree showing a strong deviation from the right one-half normal positive distribution expected from a phenotypic trait under Brownian evolution. A strong deviation would be expected for a trait under proportional evolution. (B) Quantile distribution of the absolute value of the standardized contrasts. These contrasts do not show a near-linear relationship to the positive quantile standard deviates, indicating a strong deviation from a right one-half normal positive distribution. This is expected for a trait under proportional evolution.
Figure 4.
Figure 4.
A priori Log10 transformation of genome size removes the proportional effect of genome size on the rate of genome size evolution. (A) A tree-wise analysis of the nodal estimated genome size and the calculated contrast at each node shows no significant correlation. (B) The distribution of the median absolute contrast and the median genome size of 20 traditionally recognized taxonomic groups also shows no significant correlation. Bars represent bootstrapped 95% confidence intervals. As in Figure 3A, red dots represent estimations from the 31-ortholog tree and black dots represent estimations from the 18S rDNA tree.
Figure 5.
Figure 5.
(A) Distribution of the absolute value of the standardized contrasts calculated from Log10-transformed genome size and the 18S rDNA tree. This calculation shows approximately a right one-half normal positive distribution expected from a phenotypic trait under Brownian evolution. (B) Quantile distribution of the absolute value of the standardized contrasts calculated from Log10-transformed genome size data. These contrasts show a near-linear relationship to the positive quantile standard deviates, indicating the expected right one-half normal positive distribution of the contrasts for a phenotypic trait under Brownian evolution.
Figure 6.
Figure 6.
Distribution of genome sizes used in this analysis in linear space (A) and logarithmic space (B) exhibit a log-normal distribution, as predicted by proportional evolution integrated over long time periods.

References

    1. Albertini A.M., Hofer M., Calos M.P., Miller J.H., Hofer M., Calos M.P., Miller J.H., Calos M.P., Miller J.H., Miller J.H. On the formation of spontaneous deletions: The importance of short sequence homologies in the generation of large deletions. Cell. 1982;29:319–328. - PubMed
    1. Arkhipova I., Meselson M., Meselson M. Transposable elements in sexual and ancient asexual taxa. Proc. Natl. Acad. Sci. 2000;97:14473–14477. - PMC - PubMed
    1. Bebenek K., Kunkel T.A., Kunkel T.A. Frameshift errors initiated by nucleotide misincorporation. Proc. Natl. Acad. Sci. 1990;87:4946–4950. - PMC - PubMed
    1. Bookstein F.L. Random walk and the existence of evolutionary rates. Paleobiology. 1987;13:446–464.
    1. Cavalier-Smith T. Economy, speed and size matter: Evolutionary forces driving nuclear genome miniaturization and expansion. Ann. Bot. 2005;95:147–175. - PMC - PubMed

Publication types

LinkOut - more resources