. 2007 Apr 16;204(4):747-58.
doi: 10.1084/jem.20062024. Epub 2007 Apr 9.

IgG1 B cell receptor signaling is inhibited by CD22 and promotes the development of B cells whose survival is less dependent on Ig alpha/beta

Affiliations

IgG1 B cell receptor signaling is inhibited by CD22 and promotes the development of B cells whose survival is less dependent on Ig alpha/beta

Ari Waisman et al. J Exp Med. .

Abstract

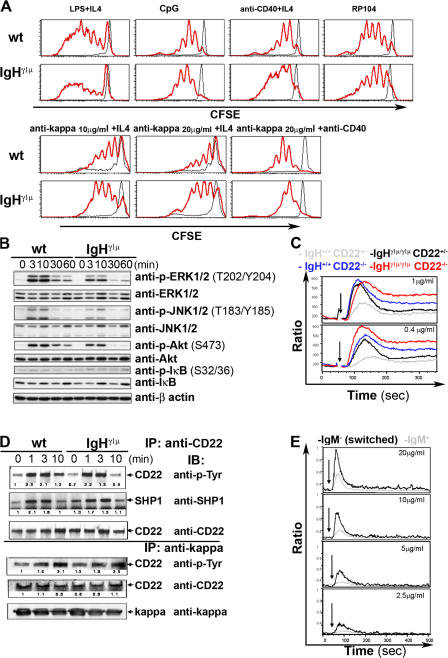
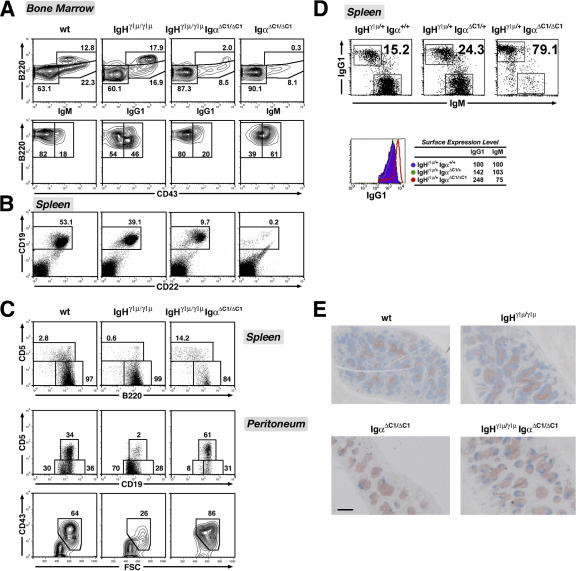
We describe a mouse strain in which B cell development relies either on the expression of membrane-bound immunoglobulin (Ig) gamma1 or mu heavy chains. Progenitor cells expressing gamma1 chains from the beginning generate a peripheral B cell compartment of normal size with all subsets, but a partial block is seen at the pro- to pre-B cell transition. Accordingly, gamma1-driven B cell development is disfavored in competition with developing B cells expressing a wild-type (WT) IgH locus. However, the mutant B cells display a long half-life and accumulate in the mature B cell compartment, and even though partial truncation of the Ig alpha cytoplasmic tail compromises their development, it does not affect their maintenance, as it does in WT cells. IgG1-expressing B cells showed an enhanced Ca(2+) response upon B cell receptor cross-linking, which was not due to a lack of inhibition by CD22. The enhanced Ca(2+) response was also observed in mature B cells that had been switched from IgM to IgG1 expression in vivo. Collectively, these results suggest that the gamma1 chain can exert a unique signaling function that can partially replace that of the Ig alpha/beta heterodimer in B cell maintenance and may contribute to memory B cell physiology.


Figures

Figure 1.
Figure 1.
The γ1 H chain supports B cell development in IgHγ1μ/γ1μ mice. (A) Genomic structure of the IgHγ1μ locus. To generate the IgHγ1μ allele, all CH regions of the IgH locus were replaced by the Cγ1 region, followed by the Cμ region in opposite transcriptional orientation, flanked by inverted loxP sites (triangles). Inversion of the loxP-flanked region by Cre recombinase generates B cells that exclusively express γ1 (IgHγ1μ) or μ (IgHμγ1; not depicted). (B) Flow cytometric analysis of splenocytes from IgHγ1μ/γ1μ mice. Expression of membrane IgG1 and IgM by CD19+ B cells is shown (top). Splenocytes were stained for CD5 and CD19 expression to estimate the ratio between T cells and B cells (second panel from the top). The ratio of κ/λ light chain usage in splenic CD19+ B cells is shown (third panel from the top). The ratio of MZ B cells (CD19+CD21brightCD23) and follicular B cells (CD19+CD21+CD23bright) is shown (fourth panel from the top). Transitional B cell fractions were determined by AA4.1 and CD23 expression levels (gated on B220+ cells; bottom). Numbers represent the percentage of cells within the designated gates. (C) In the two top panels, B cell development in the BM of IgHγ1μ/γ1μ mice. B220+ B lymphocytes are displayed and gated based on expression levels of surface Ig, B220, and the maturation marker AA4.1 to determine the immature (B220loIg+AA4.1+; fraction E) and mature (B220hiIg+AA4.1; fraction F) fractions (reference 38). The three bottom panels show the distribution of pro–B cell (CD43+CD25; fractions A–C) versus pre–B cell (CD43CD25+; fraction D) populations within B220+Ig-gated BM cells. Numbers represent the percentage of cells within the designated gates. (D) Flow cytometric analysis of peritoneal cells in IgHγ1μ/γ1μ mice. (top) Dot plots show the percentages of cells within the lymphocyte gate: T cells (CD5highCD19), B-1a cells (CD19highCD5+), B-1b cells (CD19highCD5low), and B-2 cells (CD19lwoCD5low). (bottom) The fraction of CD43+CD19hi cells within the CD19+ peritoneal B lymphocytes. (E) IgM and IgG1 titers in the sera of IgHγ1μ/γ1μ mice. Ig levels were determined by ELISA. Each dot represents values obtained from an individual mouse.
Figure 2.
Figure 2.
IgG1+ B cells are underrepresented in heterozygous IgHγ1μ/+ mice because of impaired early B cell development rather than a reduced life span. (A) IgM+ and IgG1+ fractions of CD19+ B cells from spleen, inguinal lymph nodes, and the peritoneal cavity. (right) Dot plots represent mice that were treated for 30 d with an IL-7 receptor antibody to block the influx of newly generated B cells from the BM. Controls were injected with PBS. The blocking of B cell development in mice treated with IL-7 receptor antibody was confirmed by flow cytometric analysis of the BM cells (not depicted). Numbers represent the percentage (mean ± SD) calculated from two experiments with a total of eight mice. (B) Life spans of B cells in IgHγ1μ/γ1μ and IgHγ1μ/γ1μ IgαΔc1/Δc1 mice. After a labeling period of 1 mo, BrdU incorporation in mature peripheral blood B lymphocytes (CD19+CD21+) was measured at the indicated time points (day 0 = beginning of chase period). Each symbol represents an individual mouse, and the horizontal lines represent the mean. Calculated decay curves and half-lives are shown.
Figure 3.
Figure 3.
BAFF-R dependence of IgG1+ B cells. (A) BAFF-R expression levels in CD19+ splenic B cells. (B) Flow cytometric analysis of splenic B cells from IgHγ1μ/+ BAFF-R−/− mice. IgG1+ B cells depend on BAFF-R for maintenance. (top) B220+ B cells from IgHγ1μ/+ BAFF-R−/− mice and IgHγ1μ/+ BAFF-R−/+ controls. (bottom) The IgM+ and IgG1+ B cell fractions from the top panel are further analyzed for their mature (AA4.1) versus immature (AA4.1+) composition. Numbers represent the percentage of cells within the designated gates.
Figure 4.
Figure 4.
IgG1+ B cells show enhanced proliferative and Ca2+ responses, which are not caused by a lack of CD22 inhibition, upon BCR cross-linking. (A) Proliferative responses of IgHγ1μ/γ1μ B cells. Spleen cells from WT and IgHγ1μ/γ1μ mice were labeled with CFSE, stimulated with the indicated mitogenes, and analyzed by flow cytometry 4 d later. Histograms display CFSE fluorescence of B220+ B cells. A representative analysis of four independent experiments is shown. (B) Immunoblotting for BCR-induced JNK, ERK, Akt, and IκBα phosphorylation. Splenic follicular B cells (B220+CD21+CD23bright) from WT and IgHγ1μ/γ1μ mice were sorted with a FACSVantage and stimulated with 20 μg/ml anti-kappa for the indicated times. Whole-cell lysates were separated by SDS-PAGE and immunoblotted with the indicated antibodies. β-actin levels are shown as a loading control. (C) Ca2+ responses of IgHγ1μ B cells upon BCR cross-linking in the absence and presence of CD22. Indo-1–loaded splenocytes were stimulated with 1 or 0.4 μg/ml anti-kappa at the time points indicated by the arrows. Histograms show Ca2+ B cell responses (CD5 Mac-1), displayed as the means of the 405/485-nm emission ratio over time. (D) Immunoprecipitation of CD22 and the BCR complex from IgHγ1μ/γ1μ splenic B cells. Splenic B cells from WT and IgHγ1μ/γ1μ mice were stimulated with 10 μg/ml anti-kappa for the indicated times, and CD22 was immunoprecipitated from the lysates. Coprecipitated proteins were detected with antiphosphotyrosine (anti–p-Tyr), anti–SHP-1, and anti-CD22. Numbers indicate the fold increase in phosphorylation of CD22 and the amount of SHP-1 precipitated compared with unstimulated WT samples, normalized to total CD22. Additionally, five experiments were analyzed, and means and SDs were calculated. The results were in the same order as in the figure: anti–p-Tyr (control), 1, 2.3 ± 0.1, 1.7 ± 0.5, and 0.8 ± 0.1; IgHγ1μ/γ1μ mice, 0.8 ± 0.1, 2.2 ± 0.1, 1.7 ± 0.3, and 1.2 ± 0.2; anti–SHP-1 (control), 1, 1.5 ± 0.8, 1.2 ± 0.8, and 1 ± 0; and IgHγ1μ/γ1μ mice, 1 ± 0.4, 1.4 ± 0.7, 1.2 ± 0.4, and 0.9 ± 0.3. To analyze CD22 association with the BCR, Igκ was immunoprecipitated from whole-cell lysates of splenic B cells. Coprecipitation of phosphorylated and total CD22 was determined by immunoblotting. Numbers at the bottom of each panel indicate fold increases of coprecipitated phosphorylated CD22 or coprecipitated total CD22 compared with unstimulated WT samples, normalized to anti-kappa signal. Means and SDs were calculated from three experiments in the same order as in the figure: anti–p-Tyr (control), 1, 1.3 ± 0.3, and 1.4 ± 0.5; IgHγ1μ/ γ1μ mice, 10 ± 0.2, 1.3 ± 0.5, and 1.7 ± 1; total CD22 (control), 1, 1.1 ± 0.1, and 1 ± 0.1; and IgHγ1μ/γ1μ mice, 0.9 ± 0.1, 1.1 ± 0.2, and 1.1 ± 0.1. (E) Ca2+ mobilization upon BCR cross-linking in splenic B cells carrying the IgHμγ1 allele, which were acutely switched to IgG1 orientation. Purified splenic B cells from IgHμγ1/JHT Cre-ERT2 mice treated with tamoxifen were stained with Cy5-conjugated anti-IgM Fab fragments and loaded with Fluo-3 and Fura Red. Loaded cells were gated for IgM+ or IgM (switched) and stimulated with the indicated doses of anti-kappa at the time points indicated by the arrows. The relative intracellular Ca2+ concentration is displayed as the ratio between Fluo-3 and Fura Red mean fluorescence intensity over time.
Figure 5.
Figure 5.
IgHγ1μ B cells are less dependent on the Igα cytoplasmic domain than WT B cells. Flow cytometric analysis of compound mutant animals with the IgHγ1μ and IgαΔc1 alleles. (A) BM B220+ B cell subsets from mice with the indicated genotypes to determine the fractions of recirculating (B220highIg+; fraction F) and immature (B220lowIg+; fraction E) B cells. (bottom) B220+Ig BM cells were gated based on CD43 expression of pro– (CD43+; fractions A–C) and pre–B cells (CD43; fraction D). (B) Splenic lymphocytes were stained for CD19 and CD22 expression. Note that CD22 expression levels are comparable for B cells from WT and IgHγ1μ/γ1μ mice. (C) Splenic (top) and peritoneal (middle) CD19+ B cells were analyzed for CD5 surface expression. (bottom) The size and CD43 expression levels of peritoneal CD19+ cells. (D, top) CD19+ splenic B cells from heterozygous IgHγ1μ mice with the Igα mutation were analyzed for the expression of IgM and IgG1. (bottom) Relative surface expression levels (percentages) of IgG1 and IgM for CD19+ splenic B cells. Expression levels in the context of WT Igα are set to 100. The histogram shows a representative example. Numbers in A–D indicate the percentage of cells within the designated gates. (E) Spleen sections stained by immunohistochemistry to identify B cells (blue) and T cells (red). Bar, 1 mm.

Similar articles

Cited by

References

    1. Reth, M. 1994. B cell antigen receptors. Curr. Opin. Immunol. 6:3–8. - PubMed
    1. Geisberger, R., R. Crameri, and G. Achatz. 2003. Models of signal transduction through the B-cell antigen receptor. Immunology. 110:401–410. - PMC - PubMed
    1. Neuberger, M.S., H.M. Caskey, S. Pettersson, G.T. Williams, and M.A. Surani. 1989. Isotype exclusion and transgene down-regulation in immunoglobulin-lambda transgenic mice. Nature. 338:350–352. - PubMed
    1. Achatz, G., L. Nitschke, and M.C. Lamers. 1997. Effect of transmembrane and cytoplasmic domains of IgE on the IgE response. Science. 276:409–411. - PubMed
    1. Kaisho, T., F. Schwenk, and K. Rajewsky. 1997. The roles of gamma 1 heavy chain membrane expression and cytoplasmic tail in IgG1 responses. Science. 276:412–415. - PubMed

Publication types

MeSH terms