Comparative Study
. 2007 Jun;27(12):4475-87.
doi: 10.1128/MCB.00208-07. Epub 2007 Apr 9.

The three-dimensional structure of human interphase chromosomes is related to the transcriptome map

Affiliations
Comparative Study

The three-dimensional structure of human interphase chromosomes is related to the transcriptome map

Sandra Goetze et al. Mol Cell Biol. 2007 Jun.

Abstract

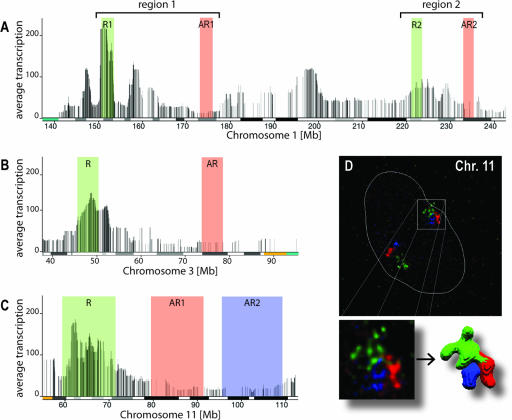
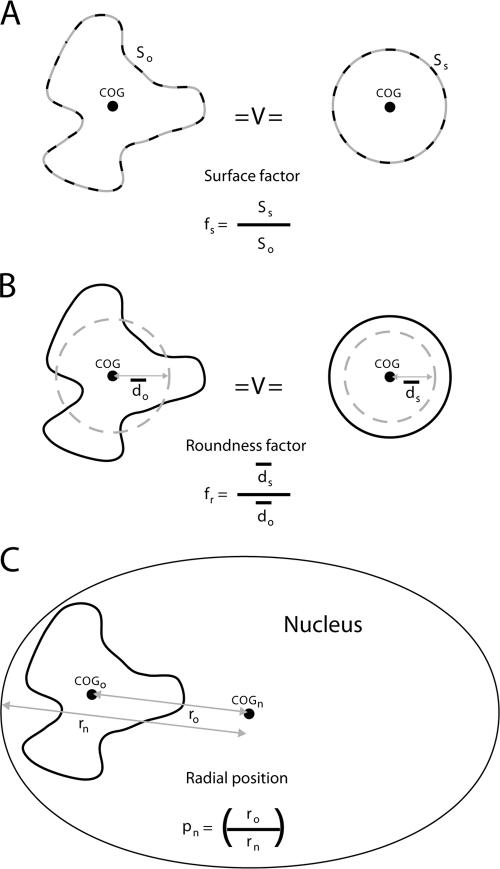
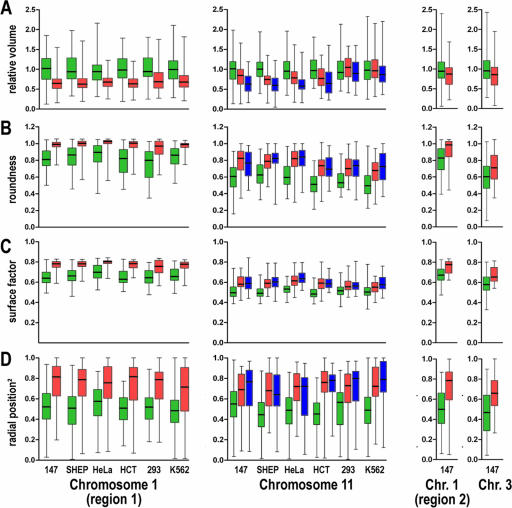
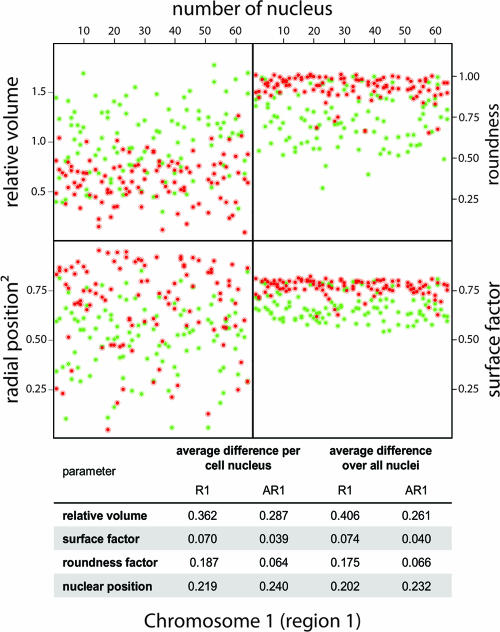
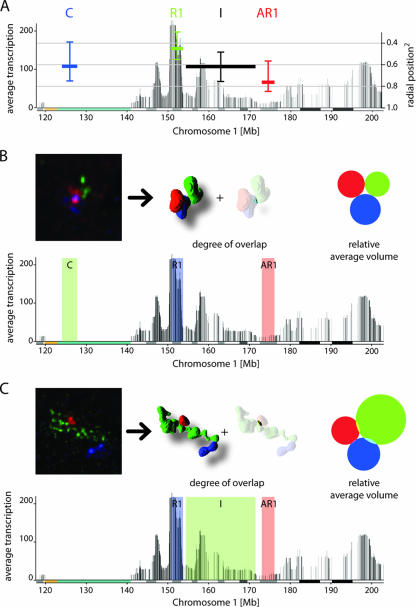
The three-dimensional (3D) organization of the chromosomal fiber in the human interphase nucleus is an important but poorly understood aspect of gene regulation. Here we quantitatively analyze and compare the 3D structures of two types of genomic domains as defined by the human transcriptome map. While ridges are gene dense and show high expression levels, antiridges, on the other hand, are gene poor and carry genes that are expressed at low levels. We show that ridges are in general less condensed, more irregularly shaped, and located more closely to the nuclear center than antiridges. Six human cell lines that display different gene expression patterns and karyotypes share these structural parameters of chromatin. This shows that the chromatin structures of these two types of genomic domains are largely independent of tissue-specific variations in gene expression and differentiation state. Moreover, we show that there is remarkably little intermingling of chromatin from different parts of the same chromosome in a chromosome territory, neither from adjacent nor from distant parts. This suggests that the chromosomal fiber has a compact structure that sterically suppresses intermingling. Together, our results reveal novel general aspects of 3D chromosome architecture that are related to genome structure and function.


Figures

FIG. 1.
FIG. 1.
Investigated ridges and antiridges on chromosomes 1, 3, and 11. The HTMs of parts of chromosomes 1, 3, and 11 illustrate the clustering of highly expressed genes in ridges (R, green) and genes expressed at low levels in antiridges (AR, green and blue). Each vertical line in the map represents a gene, and the height of the line indicates the median gene activity averaged over a moving window of 49 genes. Below the HTM the Giemsa banding pattern is indicated, marking G-negative bands (white bars), G-positive bands (black bars), intermediate levels of Giemsa staining (gray bars), and pericentromeric repeats (colored) (see also Table S1 at http://staff.science.uva.nl/∼roeld/). (D) Representative 3D FISH images of the investigated ridge and two antiridges on chromosome 11 in human primary fibroblasts (04-147), shown as a maximum-intensity projection and after volume rendering, using the same color coding as in the HTM. The dotted white lines mark the contour of the nucleus.
FIG. 2.
FIG. 2.
Surface factor, roundness factor, and radial position. Two parameters were determined as a measure of the shapes of ridges and antiridges: the surface factor fs and the roundness factor fr. (A) The surface factor (fs = Ss/So) is the surface So of a given chromosomal domain/object normalized to the surface of a sphere (Ss) with an equal volume. (B) The roundness factor (fr) is the average distance ds of any point in a sphere to the center of gravity (COG) divided by the same parameter do in a chromosomal domain with identical volume. The value fs is a measure of the irregularity of the domain surface, whereas fr is a measure of the overall shape of a domain. (C) The radial nuclear position pn (pn = ro/rn) of a chromosomal domain was calculated as the distance between the center of gravity of a domain and the center of the nucleus (ro) divided by the length of a line from the nuclear center to the nuclear envelope through the center of gravity of the domain (rn).
FIG. 3.
FIG. 3.
Transcription profiles of relevant areas on chromosomes 1 (region 1) and 11 of the six human cell lines investigated. Each vertical line represents a gene. Its height depicts the median expression of that gene and the 24 genes at the left and at the right of the gene (median of a moving window of 49 genes). The ridge and antiridge areas investigated are color coded in green (ridges) and red and blue (antiridges). The transcription profiles illustrate that the large differences in transcriptional activity between ridges and antiridges are conserved in all cell types. At the same time, the expression levels of individual genes vary significantly. (See also Fig. S2 at http://staff.science.uva.nl/∼roeld/.)
FIG. 4.
FIG. 4.
Structural parameters of ridges and antiridges in 04-147, SH-EP, HeLa, HCT, 293, and K562 cells. Box plots show the four quartiles of the distribution of various structural parameters measured for ridges (green) and antiridges (red and blue) on the q arms of chromosomes 1 and 11 and the p arm of chromosome 3. The boxes extend from the 25th to the 75th percentiles, with a horizontal line marking the median. The whiskers above and below the boxes show the highest and the lowest values determined in the course of our experiments. Each distribution contains information for approximately 50 cells. Results are shown on two chromosomes for primary fibroblasts and five different established cell lines. The third column summarizes results acquired with human primary fibroblasts only. (A) Relative volume per Mb of ridges and antiridges, showing that ridges have an about 1.4-times-larger volume per Mb than antiridges. (B) Roundness of ridges and antiridges, showing that antiridges are more sphere-like than ridges. (C) Surface factors of ridges and antiridges, showing that the surfaces of antiridges are less convoluted than those of ridges. (D) Squared radial positions of ridges and antiridges, showing that ridges are located more towards the nuclear center and antiridges more towards the nuclear periphery. All measurements show a considerable cell-to-cell variation, implying a high flexibility in 3D chromatin structure. The six cell types are indicated below the x axis. Chr., chromosome.
FIG. 5.
FIG. 5.
Structural parameters of ridges and antiridges on homologous chromosomes in identical nuclei. Values for relative volume, roundness, surface factor, and nuclear position of the chromosome 1 ridge R1 and antiridge AR1 in human primary fibroblasts are shown per cell nucleus. Green spots indicate ridges, while red spots indicate antiridges. In total, 65 nuclei were evaluated (number of nucleus). The graphical representation and the table show that the variation between relative volume, roundness, surface factor, and nuclear position in identical nuclei (average difference per nucleus) is similar to the cell-to-cell variation observed for the whole population.
FIG. 6.
FIG. 6.
Radial position and absence of intermingling between subchromosomal domains on chromosome 11. (A) The 11q arm was subdivided into nine domains as indicated by horizontal bars in the chromosome 11q HTM: the centromere (C), the ridge (R), three antiridges (AR1 to AR3), and four areas of intermediate transcriptional activity (I to IV). The horizontal bars in the HTM mark the extents of the nine domains. The vertical positions of the bars relate to the squared radial nuclear position (y axis on the right). The vertical lines above and below the bars correspond to the second and third quartile of a box plot. The white line in the image marks the edge of the nucleus. (B to D) Three simultaneously FISH-labeled domains are indicated and color coded on the chromosome 11 transcriptome map. The volumes of the subchromosomal domains and the overlap between them were determined. The 3D-rendered image represent a typical triad of FISH-labeled domains and their respective overlap (n = 40 to 50). The surface areas of the colored circles correspond to the relative average domain volumes and display the measured overlap between the domains. Our measurements reveal remarkably little intermingling between subchromosomal domains. Note that AR1 and domain III in panel C share 22% of the FISH probes on the linear DNA and serve as a positive control for measurements of overlap.
FIG. 7.
FIG. 7.
Radial position and absence of intermingling between subchromosomal domains on chromosome 1. (A) Four domains on the HTM of chromosome 1 were investigated: centromeric repeats (C), ridge R1, antiridge AR1, and an area of intermediate transcriptional activity (I). The horizontal bars in the HTM mark the extents of the four domains. The vertical positions of the bars relate to the squared radial nuclear position (y axis on the right). The vertical lines above and below the bars correspond to the second and third quartiles of a box plot. Nuclear position measurements showed a radial orientation of the chromosome arm, with the ridge being oriented more to the nuclear interior (pn2 ∼ 0.5) and the antiridge more peripheral (pn2 ∼ 0.8). (B and C) Three simultaneously FISH labeled domains on the chromosome 1 transcriptome map. 3D-rendered images represent a typical example of FISH-labeled domains and their respective overlap. The surface areas of the colored circles relate to the average domain volumes and display the overlap of the domains in 40 to 50 nuclei.
FIG. 8.
FIG. 8.
Chromosomal fiber model of the interphase chromosome. Human interphase chromosomes consist of a compact chromosomal fiber (indicated by a dashed line surrounding the chromatin fiber). This chromosomal fiber is thicker in ridges (green) and thinner in antiridges (red). Consequently, in agreement with volume and shape measurements, the chromatin fiber in such a superordinate chromosomal fiber is more decondensed and flexible in ridges than in antiridges. In the human interphase nucleus the chromosomal fiber is arranged so that antiridges are more peripheral, while ridges are more internal.

Similar articles

Cited by

References

    1. Archidiacono, N., R. Antonacci, R. Marzella, P. Finelli, A. Lonoce, and M. Rocchi. 1995. Comparative mapping of human alphoid sequences in great apes using fluorescence in situ hybridization. Genomics 25:477-484. - PubMed
    1. Bolzer, A., G. Kreth, I. Solovei, D. Koehler, K. Saracoglu, C. Fauth, S. Muller, R. Eils, C. Cremer, M. R. Speicher, and T. Cremer. 2005. Three-dimensional maps of all chromosomes in human male fibroblast nuclei and prometaphase rosettes. PLoS Biol. 3:e157. - PMC - PubMed
    1. Boyle, S., S. Gilchrist, J. M. Bridger, N. L. Mahy, J. A. Ellis, and W. A. Bickmore. 2001. The spatial organization of human chromosomes within the nuclei of normal and emerin-mutant cells. Hum. Mol. Genet. 10:211-219. - PubMed
    1. Branco, M. R., and A. Pombo. 2006. Intermingling of chromosome territories in interphase suggests role in translocations and transcription-dependent associations. PLoS Biol. 4:e138. - PMC - PubMed
    1. Bridger, J. M., S. Boyle, I. R. Kill, and W. A. Bickmore. 2000. Re-modelling of nuclear architecture in quiescent and senescent human fibroblasts. Curr. Biol. 10:149-152. - PubMed

Publication types