. 2007 Apr 17;104(16):6632-7.
doi: 10.1073/pnas.0700149104. Epub 2007 Apr 9.

High-affinity single-domain binding proteins with a binary-code interface

Affiliations

High-affinity single-domain binding proteins with a binary-code interface

Akiko Koide et al. Proc Natl Acad Sci U S A. .

Abstract

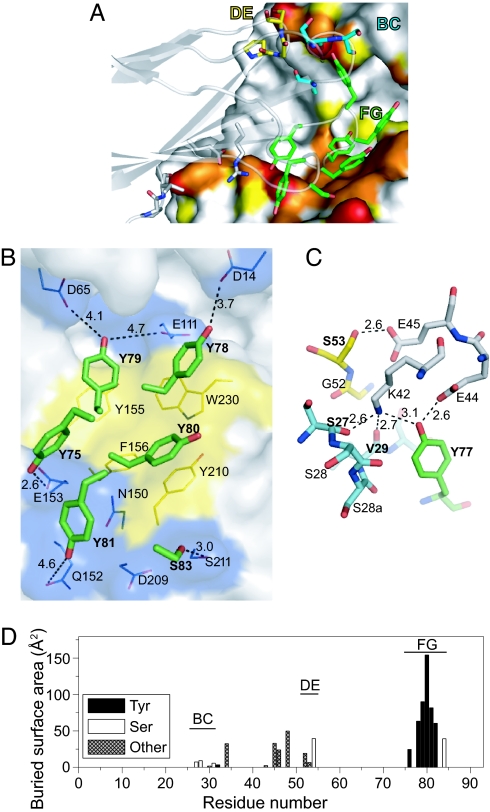
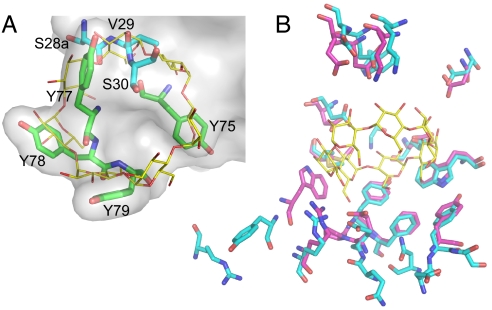
High degrees of sequence and conformation complexity found in natural protein interaction interfaces are generally considered essential for achieving tight and specific interactions. However, it has been demonstrated that specific antibodies can be built by using an interface with a binary code consisting of only Tyr and Ser. This surprising result might be attributed to yet undefined properties of the antibody scaffold that uniquely enhance its capacity for target binding. In this work we tested the generality of the binary-code interface by engineering binding proteins based on a single-domain scaffold. We show that Tyr/Ser binary-code interfaces consisting of only 15-20 positions within a fibronectin type III domain (FN3; 95 residues) are capable of producing specific binding proteins (termed "monobodies") with a low-nanomolar K(d). A 2.35-A x-ray crystal structure of a monobody in complex with its target, maltose-binding protein, and mutation analysis revealed dominant contributions of Tyr residues to binding as well as striking molecular mimicry of a maltose-binding protein substrate, beta-cyclodextrin, by the Tyr/Ser binary interface. This work suggests that an interaction interface with low chemical diversity but with significant conformational diversity is generally sufficient for tight and specific molecular recognition, providing fundamental insights into factors governing protein-protein interactions.


Conflict of interest statement

The authors declare no conflict of interest.

Figures

Fig. 1.
Fig. 1.
Amino acid sequences of Y/S monobodies. (A) A schematic drawing of the monobody scaffold. β-Strands A–G and the three loops that are diversified in the library are indicated. (B) Affinity and amino acid sequences of Y/S monobodies that were selected from the initial library selection. The number of occurrences for clones that appeared more than once is indicated in parentheses. Kd values determined by using yeast surface display are also shown. The sequences for the three loops are shown, with the numbering of Main et al. (20). Tyr, Ser, and the other amino acids are shaded in yellow, red, and gray, respectively.
Fig. 2.
Fig. 2.
Binding affinity and specificity of Y/S monobodies. (A) Titration curves for three MBP-binding monobodies tested by using yeast surface display. Binding of MBP to the monobodies displayed on the yeast surface is shown as a function of MBP concentration. The vertical axis indicates the level of MBP binding (PE fluorescence) normalized with respect to the level of monobody display (FITC fluorescence). (B) SPR sensorgrams for the interaction between the MBP-74 monobody and MBP. Sensorgrams of 10, 20, 50, and 100 nM MBP binding to the immobilized monobody are shown. The dashed and solid curves show the experimental data and the global fit of the 1:1 binding model, respectively. (C–E) Binding specificity of monobodies tested with three different targets and yeast surface display. The levels of binding to hSUMO4 (C), ySUMO (D), and MBP (E) were measured by using yeast surface display in a similar manner as in A. Monobodies 33 and 39 were selected with hSUMO4, monobodies 52 and 57 were selected with ySUMO, and monobodies 73, 74, and 76 were selected with MBP. Binding to the cognate target is indicated with an asterisk. Note that, because of different detection sensitivities of different targets, one can compare binding of different monobodies to the same target (i.e., data within a single panel), but not binding of one monobody to different targets (i.e., data across panels).
Fig. 3.
Fig. 3.
The x-ray crystal structure of the MBP–monobody MBP-74 fusion protein. (A) A helical rod of the fusion proteins formed in the crystal along crystallographic 41-screw axis. Four symmetry-related copies of the fusion protein are shown in different colors, and the MBP and monobody portions are shown in lighter and darker shades, respectively. A schematic representation of the packing is also shown. (B) The binding complex of MBP (white) and monobody (blue) with the MBP fusion partner (cyan). A close-up image of the linker region with electron density is also shown. (C) The binding complex rotated ≈90° along the vertical axis with respect to that shown in B. (D) The epitope shown on the MBP surface. Red, orange, and yellow surfaces indicate those for atoms within 3.2, 4.0, and 5.0 Å of monobody atoms, respectively. (E) Epitope mapped by NMR spectroscopy. Red, yellow, and white spheres indicate the Cα atom positions for residues whose NMR signals are strongly affected, weakly affected, and not affected, respectively. (F) A comparison of the backbone conformation of the recognition loops between monobody MBP-74 and wild-type FNfn10 (PDB ID code 1FNF). The BC, DE, and FG loops of the monobody are shown in cyan, yellow, and green, respectively, and those of wild-type FNfn10 are shown in tan. Residue numbers are also shown.
Fig. 4.
Fig. 4.
The binding interface of the MBP-74 monobody and MBP. (A) The monobody paratope residues are shown as stick models, and the MBP epitope surface is shown in the same manner as in Fig. 3D. The carbon atoms of BC, DE, and FG loop residues of the monobody are in cyan, yellow, and green, respectively. The oxygen and nitrogen atoms are shown in red and blue, respectively. The monobody backbone is also shown as a transparent cartoon model. (B) Interactions between the monobody FG loop residues (stick models) and the MBP bottom lobe epitope (shown as surfaces). The surfaces of aromatic residues are shown in yellow. Potential polar interactions for the hydroxyl oxygen atom of the paratope Tyr residues are shown as dashed lines with their distances. The monobody residues are indicated in bold. (C) The interactions in the top lobe epitope. MBP residues are drawn with carbon atoms in gray. The carbon atoms of BC, DE, and FG loop residues of the monobody are in cyan, yellow, and green, respectively. (D) The buried surface areas of the monobody residues. Only those for the binding complex are shown.
Fig. 5.
Fig. 5.
Structural mimicry of βCD by the monobody. (A) Superposition of βCD bound to MBP (PDB ID code 1DMB) and the monobody paratope residues. MBP Cα atoms were used to superimpose the two structures. Only residues in the monobody paratope that overlap with βCD are shown. The surface is drawn for the entire monobody. The carbon atoms of βCD are shown in yellow, and those of the monobody are color-coded in the same manner as in Fig. 4A. (B) Comparison of the MBP epitope to βCD (carbon atoms in magenta) with that to the MBP-74 monobody (carbon atoms in cyan).

References

    1. Lo Conte L, Chothia C, Janin J. J Mol Biol. 1999;285:2177–2198. - PubMed
    1. Fellouse FA, Li B, Compaan DM, Peden AA, Hymowitz SG, Sidhu SS. J Mol Biol. 2005;348:1153–1162. - PubMed
    1. Fellouse FA, Wiesmann C, Sidhu SS. Proc Natl Acad Sci USA. 2004;101:12467–12472. - PMC - PubMed
    1. Bogan AA, Thorn KS. J Mol Biol. 1998;280:1–9. - PubMed
    1. Fellouse FA, Barthelemy PA, Kelley RF, Sidhu SS. J Mol Biol. 2006;357:100–114. - PubMed

Publication types

MeSH terms

Associated data