A cortical potential reflecting cardiac function
- PMID: 17420478
- PMCID: PMC1871868
- DOI: 10.1073/pnas.0609509104
A cortical potential reflecting cardiac function
Abstract
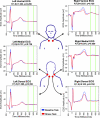
Emotional trauma and psychological stress can precipitate cardiac arrhythmia and sudden death through arrhythmogenic effects of efferent sympathetic drive. Patients with preexisting heart disease are particularly at risk. Moreover, generation of proarrhythmic activity patterns within cerebral autonomic centers may be amplified by afferent feedback from a dysfunctional myocardium. An electrocortical potential reflecting afferent cardiac information has been described, reflecting individual differences in interoceptive sensitivity (awareness of one's own heartbeats). To inform our understanding of mechanisms underlying arrhythmogenesis, we extended this approach, identifying electrocortical potentials corresponding to the cortical expression of afferent information about the integrity of myocardial function during stress. We measured changes in cardiac response simultaneously with electroencephalography in patients with established ventricular dysfunction. Experimentally induced mental stress enhanced cardiovascular indices of sympathetic activity (systolic blood pressure, heart rate, ventricular ejection fraction, and skin conductance) across all patients. However, the functional response of the myocardium varied; some patients increased, whereas others decreased, cardiac output during stress. Across patients, heartbeat-evoked potential amplitude at left temporal and lateral frontal electrode locations correlated with stress-induced changes in cardiac output, consistent with an afferent cortical representation of myocardial function during stress. Moreover, the amplitude of the heartbeat-evoked potential in the left temporal region reflected the proarrhythmic status of the heart (inhomogeneity of left ventricular repolarization). These observations delineate a cortical representation of cardiac function predictive of proarrhythmic abnormalities in cardiac repolarization. Our findings highlight the dynamic interaction of heart and brain in stress-induced cardiovascular morbidity.
Conflict of interest statement
The authors declare no conflict of interest.
Figures


Similar articles
-
Mental stress and sudden cardiac death: asymmetric midbrain activity as a linking mechanism.Brain. 2005 Jan;128(Pt 1):75-85. doi: 10.1093/brain/awh324. Epub 2004 Oct 20. Brain. 2005. PMID: 15496434
-
Cortical Representation of Afferent Bodily Signals in Borderline Personality Disorder: Neural Correlates and Relationship to Emotional Dysregulation.JAMA Psychiatry. 2015 Nov;72(11):1077-86. doi: 10.1001/jamapsychiatry.2015.1252. JAMA Psychiatry. 2015. PMID: 26376409
-
The effect of mental stress on the non-dipolar components of the T wave: modulation by hypnosis.Psychosom Med. 2005 May-Jun;67(3):376-83. doi: 10.1097/01.psy.0000160463.10583.88. Psychosom Med. 2005. PMID: 15911899
-
Asymmetric sympathetic output: The dorsomedial hypothalamus as a potential link between emotional stress and cardiac arrhythmias.Auton Neurosci. 2017 Nov;207:22-27. doi: 10.1016/j.autneu.2017.01.001. Epub 2017 Jan 17. Auton Neurosci. 2017. PMID: 28131565 Review.
-
Significance of neuro-cardiac control mechanisms governed by higher regions of the brain.Auton Neurosci. 2016 Aug;199:54-65. doi: 10.1016/j.autneu.2016.08.013. Epub 2016 Aug 24. Auton Neurosci. 2016. PMID: 27595200 Review.
Cited by
-
Neural traces of stress: cortisol related sustained enhancement of amygdala-hippocampal functional connectivity.Front Hum Neurosci. 2013 Jul 5;7:313. doi: 10.3389/fnhum.2013.00313. eCollection 2013. Front Hum Neurosci. 2013. PMID: 23847492 Free PMC article.
-
Dynamic neurocognitive changes in interoception after heart transplant.Brain Commun. 2020 Jul 8;2(2):fcaa095. doi: 10.1093/braincomms/fcaa095. eCollection 2020. Brain Commun. 2020. PMID: 32954340 Free PMC article.
-
Synergistic application of cardiac sympathetic decentralization and comprehensive psychiatric treatment in the management of anxiety and electrical storm.Front Integr Neurosci. 2014 Jan 2;7:98. doi: 10.3389/fnint.2013.00098. eCollection 2014. Front Integr Neurosci. 2014. PMID: 24427121 Free PMC article.
-
Exploring the Link Between Interoception and Symptom Severity in Premature Ventricular Contractions.J Clin Med. 2024 Dec 19;13(24):7756. doi: 10.3390/jcm13247756. J Clin Med. 2024. PMID: 39768680 Free PMC article.
-
Responses to Heartbeats in Ventromedial Prefrontal Cortex Contribute to Subjective Preference-Based Decisions.J Neurosci. 2021 Jun 9;41(23):5102-5114. doi: 10.1523/JNEUROSCI.1932-20.2021. Epub 2021 Apr 29. J Neurosci. 2021. PMID: 33926998 Free PMC article.
References
-
- Lane R-D, Laukes C, Marcus F-I, Chesney M-A, Sechrest L, Gear K, Fortm C-L, Priori S-G, Schwartz P-J, Steptoe A. Psychosom Med. 2005;67:359–365. - PubMed
-
- Lampert R, Shusterman V, Burg M-M, Lee F-A, Earley C, Goldberg A, McPherson C-A, Batsford W-P, Soufer R. J Cardiovasc Electrophysiol. 2005;16:372–377. - PubMed
-
- Oppenheimer S-M, Cechetto D-F, Hachinski V-C. Arch Neurol. 1990;47:513–519. - PubMed
-
- Taggart P, Sutton P, Redfern C, Batchvarov V-N, Hnatkova K, Malik M, James U, Joseph A. Psychosom Med. 2005;67:376–383. - PubMed
Publication types
MeSH terms
Grants and funding
LinkOut - more resources
Full Text Sources
Medical
Molecular Biology Databases

