

Pharmacokinetic-pharmacodynamic modelling of S(-)-atenolol in rats: reduction of isoprenaline-induced tachycardia as a continuous pharmacodynamic endpoint
- PMID: 17420778
- PMCID: PMC2013984
- DOI: 10.1038/sj.bjp.0707234
Pharmacokinetic-pharmacodynamic modelling of S(-)-atenolol in rats: reduction of isoprenaline-induced tachycardia as a continuous pharmacodynamic endpoint
Abstract
Background and purpose: For development of mechanism-based pharmacokinetic-pharmacodynamic (PK-PD) models, continuous recording of drug effects is essential. We therefore explored the use of isoprenaline in the continuous measurement of the cardiovascular effects of antagonists of beta-adrenoceptors (beta-blockers). The aim was to validate heart rate as a pharmacodynamic endpoint under continuous isoprenaline-induced tachycardia by means of PK-PD modelling of S(-)-atenolol.
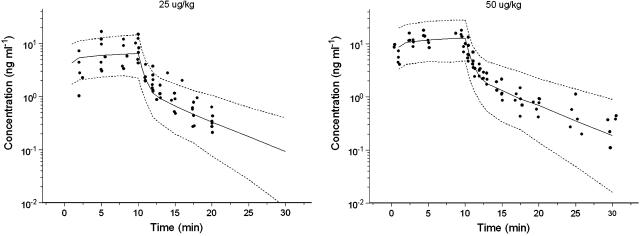
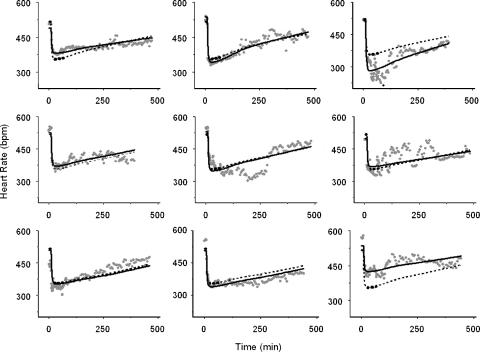
Experimental approach: Groups of WKY rats received a 15 min i.v. infusion of 5 mg kg(-1) S(-)-atenolol, with or without i.v. infusion of 5 microg kg(-1) h(-1) isoprenaline. Heart rate was continuously monitored and blood samples were taken.
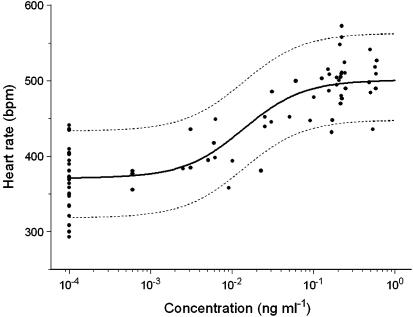
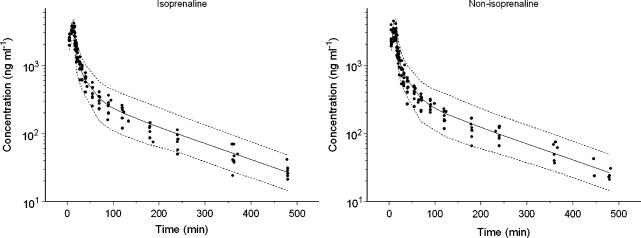
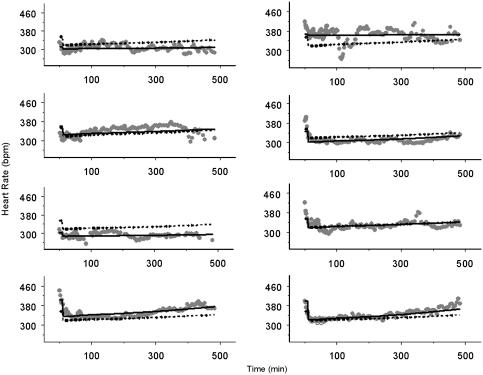
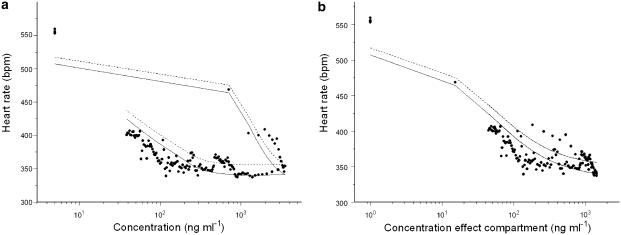
Key results: A three-compartment model best described the pharmacokinetics of S(-)-atenolol. The PK-PD relationship was described by a sigmoid Emax model and an effect compartment was used to resolve the observed hysteresis. In the group without isoprenaline, the variability in heart rate (30 b.p.m.) approximated the maximal effect (Emax=43+/-18 b.p.m.), leaving the parameter estimate of potency (EC50=28+/-27 ng ml(-1)) unreliable. Both precise and reliable parameter estimates were obtained during isoprenaline-induced tachycardia: 517+/-13 b.p.m. (E0), 168+/-15 b.p.m. (Emax), 49+/-14 ng ml(-1) (EC50), 0.042+/-0.012 min(-1) (k(eo)) and 0.95+/-0.34 (n).
Conclusions and implications: Reduction of heart rate during isoprenaline-induced tachycardia is a reliable pharmacodynamic endpoint for beta-blockers in vivo in rats. Consequently this experimental approach will be used to investigate the relationship between drug characteristics and in vivo effects of different beta-blockers.
Figures
Similar articles
-
Influence of plasma protein binding on pharmacodynamics: Estimation of in vivo receptor affinities of beta blockers using a new mechanism-based PK-PD modelling approach.J Pharm Sci. 2009 Oct;98(10):3816-28. doi: 10.1002/jps.21658. J Pharm Sci. 2009. PMID: 19117045
-
Mechanism-based pharmacodynamic modeling of S(-)-atenolol: estimation of in vivo affinity for the beta1-adrenoceptor with an agonist-antagonist interaction model.J Pharmacol Exp Ther. 2008 Mar;324(3):1234-42. doi: 10.1124/jpet.107.131680. Epub 2007 Dec 27. J Pharmacol Exp Ther. 2008. PMID: 18162599
-
Effect of altered AGP plasma binding on heart rate changes by S(-)-propranolol in rats using mechanism-based estimations of in vivo receptor affinity (K(B,vivo)).J Pharm Sci. 2010 May;99(5):2511-20. doi: 10.1002/jps.22014. J Pharm Sci. 2010. PMID: 20020526
-
Inverse PK/PD: estimation and differentiation of bioavailability from effect kinetics--observations with beta-adrenoceptor antagonists.Int J Clin Pharmacol Ther. 1997 Oct;35(10):453-7. Int J Clin Pharmacol Ther. 1997. PMID: 9352395 Review.
-
Models for evaluating the pharmacokinetics and pharmacodynamics for β-blockers.Expert Opin Drug Metab Toxicol. 2014 Apr;10(4):525-41. doi: 10.1517/17425255.2014.885951. Epub 2014 Mar 5. Expert Opin Drug Metab Toxicol. 2014. PMID: 24593316 Review.
Cited by
-
Understanding the hysteresis loop conundrum in pharmacokinetic/pharmacodynamic relationships.J Pharm Pharm Sci. 2014;17(1):34-91. J Pharm Pharm Sci. 2014. PMID: 24735761 Free PMC article.
-
Integrated TK-TD modeling for drug-induced concurrent tachycardia and QT changes in beagle dogs.J Pharmacokinet Pharmacodyn. 2017 Oct;44(5):449-462. doi: 10.1007/s10928-017-9532-2. Epub 2017 Jun 22. J Pharmacokinet Pharmacodyn. 2017. PMID: 28643108
-
Population Pharmacokinetic-Pharmacodynamic Modeling of Carvedilol to Evaluate the Effect of Cytochrome P450 2D6 Genotype on the Heart Rate Reduction.J Korean Med Sci. 2023 Jun 5;38(22):e173. doi: 10.3346/jkms.2023.38.e173. J Korean Med Sci. 2023. PMID: 37272562 Free PMC article.
-
Comparison of two pharmacodynamic transduction models for the analysis of tumor therapeutic responses in model systems.AAPS J. 2010 Mar;12(1):1-10. doi: 10.1208/s12248-009-9155-7. Epub 2009 Nov 10. AAPS J. 2010. PMID: 19902363 Free PMC article.
-
Establishment of a pharmacokinetics and pharmacodynamics model of Schisandra lignans against hippocampal neurotransmitters in AD rats based on microdi-alysis liquid chromatography-mass spectrometry.Front Pharmacol. 2024 Mar 11;15:1342121. doi: 10.3389/fphar.2024.1342121. eCollection 2024. Front Pharmacol. 2024. PMID: 38529184 Free PMC article.
References
-
- Akaike A new look at the statistical model identification. IEEE Trans Automatic Control. 1974;19:716–723.
-
- Anderson JL, Patterson E, Conlon M, Pasyk S, Pitt B, Lucchesi BR. Kinetics of antifibrillatory effects of bretylium: correlation with myocardial drug concentrations. Am J Cardiol. 1980;46:583–592. - PubMed
-
- Beal SL, Sheiner LB. NONMEM Users Guide. University of California at San Fransisco, San Fransisco, CA; 1999.
-
- Belpaire FM, De Smet F, Vynckier LJ, Vermeulen AM, Rosseel MT, Bogaert MG, et al. Effect of aging on the pharmcokinetics of atenolol, metoprolol and propranolol in the rat. J Pharmacol Exp Ther. 1990;254:116–122. - PubMed
-
- Belpaire FM, Rosseel MT, Vermeulen AM, De Smet F, Bogaert MG. Stereoselective pharmacokinetics of atenolol in the rat: influence of aging and of renal failure. Mech Ageing Dev. 1993;67:201–210. - PubMed
Publication types
MeSH terms
Substances
LinkOut - more resources
Full Text Sources
Miscellaneous
