

Long-range Lennard-Jones and electrostatic interactions in interfaces: application of the isotropic periodic sum method
- PMID: 17425357
- PMCID: PMC6413507
- DOI: 10.1021/jp068767m
Long-range Lennard-Jones and electrostatic interactions in interfaces: application of the isotropic periodic sum method
Abstract
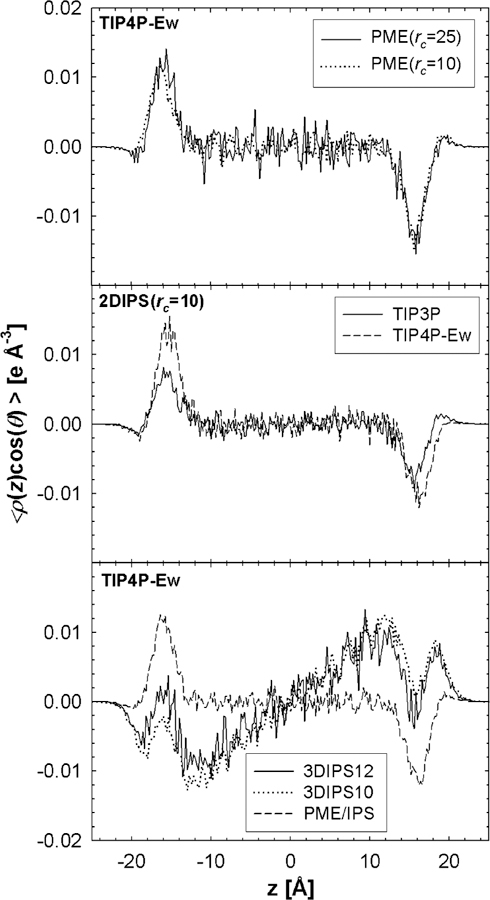
Molecular dynamics (MD) simulations of heptane/vapor, hexadecane/vapor, water/vapor, hexadecane/water, and dipalmitoylphosphatidylcholine (DPPC) bilayers and monolayers are analyzed to determine the accuracy of treating long-range interactions in interfaces with the isotropic periodic sum (IPS) method. The method and cutoff (rc) dependences of surface tensions, density profiles, water dipole orientation, and electrostatic potential profiles are used as metrics. The water/vapor, heptane/vapor, and hexadecane/vapor interfaces are accurately and efficiently calculated with 2D IPS (rc=10 A). It is demonstrated that 3D IPS is not practical for any of the interfacial systems studied. However, the hybrid method PME/IPS [Particle Mesh Ewald for electrostatics and 3D IPS for Lennard-Jones (LJ) interactions] provides an efficient way to include both types of long-range forces in simulations of large liquid/vacuum and all liquid/liquid interfaces, including lipid monolayers and bilayers. A previously published pressure-based long-range LJ correction yields results similar to those of PME/IPS for liquid/liquid interfaces. The contributions to surface tension of LJ terms arising from interactions beyond 10 A range from 13 dyn/cm for the hexadecane/vapor interface to approximately 3 dyn/cm for hexadecane/water and DPPC bilayers and monolayers. Surface tensions of alkane/vapor, hexadecane/water, and DPPC monolayers based on the CHARMM lipid force fields agree very well with experiment, whereas surface tensions of the TIP3P and TIP4P-Ew water models underestimate experiment by 16 and 11 dyn/cm, respectively. Dipole potential drops (DeltaPsi) are less sensitive to long-range LJ interactions than surface tensions. However, DeltaPsi for the DPPC bilayer (845+/-3 mV proceeding from water to lipid) and water (547+/-2 mV for TIP4P-Ew and 521+/-3 mV for TIP3P) overestimate experiment by factors of 3 and 5, respectively, and represent expected deficiencies in nonpolarizable force fields.
Figures


References
-
- Alper HE; Bassolino D; Stouch TR J. Chem. Phys 1993, 98, 9798.
-
- Feller SE; Pastor RW; Rojnuckarin A; Bogusz S; Brooks BR J. Phys. Chem 1996, 100, 17011.
-
- Jungwirth P; Tobias DJ Chem. ReV 2006, 106, 1259. - PubMed
-
- Polyansky AA; Volynsky PE; Nolde DE; Arseniev AS; Efremov RG J. Phys. Chem. B 2005, 109, 15052. - PubMed
Publication types
MeSH terms
Substances
Grants and funding
LinkOut - more resources
Full Text Sources
Research Materials
